A study of six unidentified objects in a military infrared recording has grown into a wider examination of released UAP footage. An October 16 update to the preprint led by Jacob Haqq-Misra reports bird-like brightness rhythms in 19 additional objects across nine more videos, bringing the total to 25 candidates in ten recordings.
In his account of the expanded work, co-author Avi Loeb explains the underlying clue: a bird’s infrared brightness can vary as its moving wings change the area and orientation presented to a camera. That periodic signal can be examined without first knowing the object’s distance.
Loeb says the ten videos represent roughly eight percent of sensor videos released through the first six PURSUE batches. He highlights PR097, with several candidates appearing at different points, and PR141, whose infrared and visible-light views show similar variability.
A testable interpretation, not a blanket resolution
The updated paper gives brightness frequencies of 2.3 to 11 cycles per second for the additional objects. Its authors report checks against background signals and video encoding effects. They also acknowledge that a tumbling object could produce periodic changes and that the recordings lack range measurements needed to determine physical sizes and speeds.
The manuscript is listed as submitted to Scientific Reports. Its appearance on arXiv should not be confused with completed journal peer review or an official resolution of every case.
For readers, the useful advance is an expanded set of measurements that others can challenge. The eight-percent figure describes this released collection under this particular test; it should not be treated as a measured bird fraction for all UAP reports. Stronger case conclusions will require the underlying sensor and aircraft information alongside the pixels.
Reporting checked October 20, 2026 (UTC). Catch-up coverage of the October 16 research update.
A striking radio image nicknamed the “Treble Clef” may preserve the aftermath of two events: an old eruption from a supermassive black hole and a later collision between galaxy clusters. But the interesting question is not why the structure resembles musical notation. It is how astronomers distinguish a plausible reconstruction from a directly observed event.
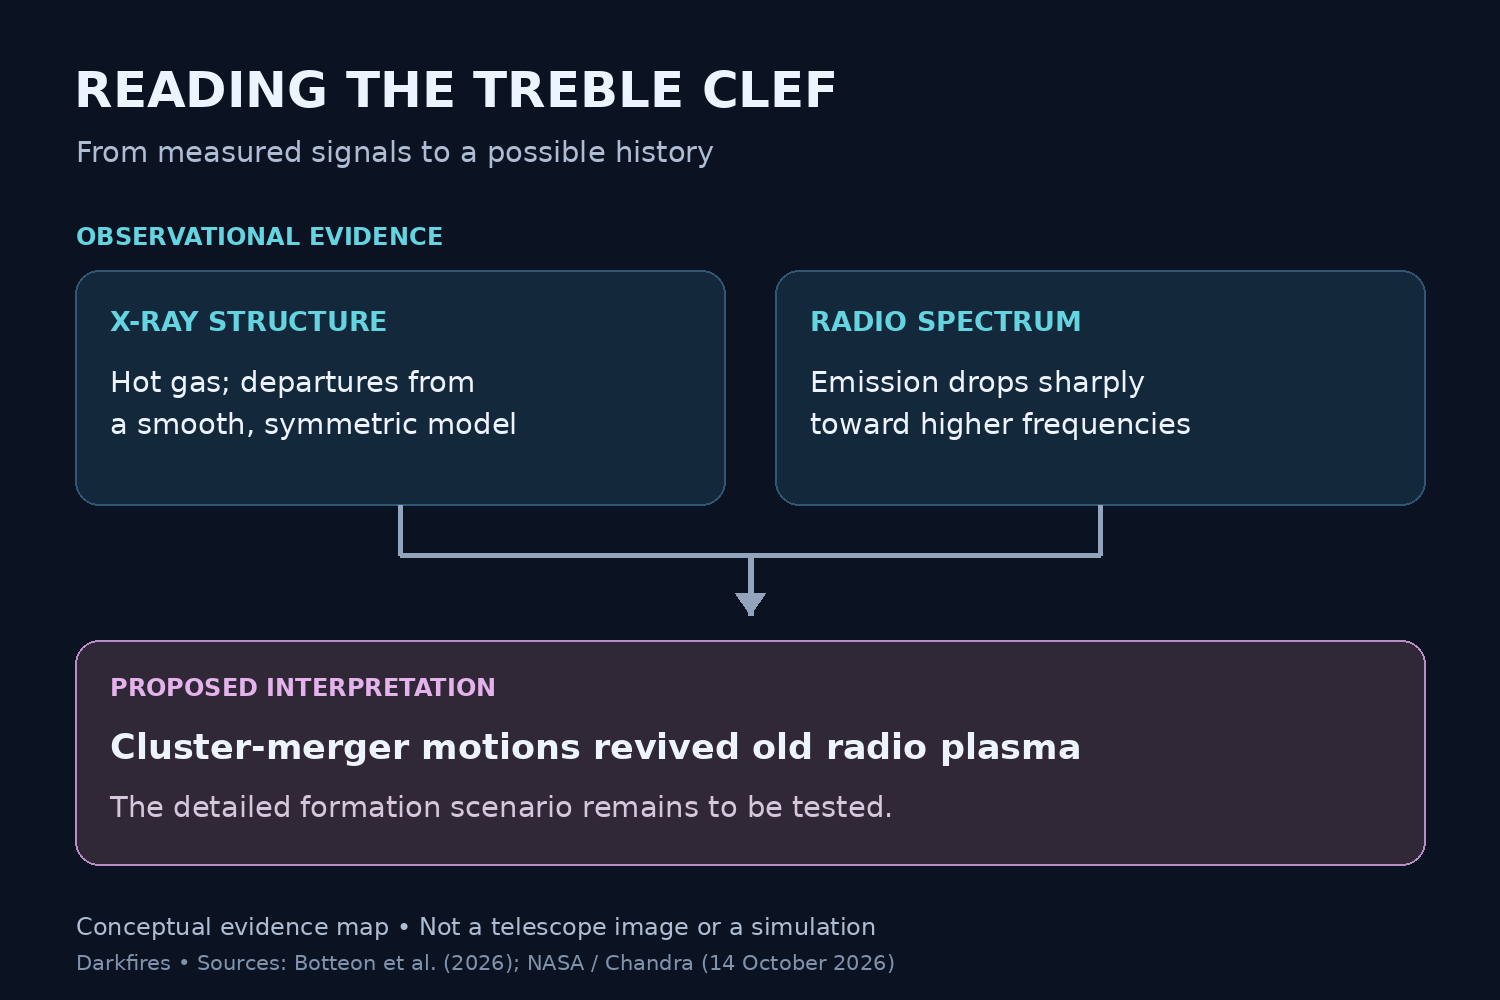
NASA’s October 14 release presents a composite of radio, infrared and X-ray observations. The target lies behind the Milky Way’s crowded plane. Chandra and eROSITA reveal hot gas associated with its host cluster; LOFAR supplies the conspicuous radio structure. Removing a smooth, approximately oval model of the X-ray emission exposes excess brightness on opposite sides of the center. The researchers interpret that pattern as evidence of a cluster merger.
That subtraction is important: the picture combines observations with processing designed to expose otherwise subtle structure. It is evidence from which a history can be reconstructed, rather than a recording of the collision itself.
The team classifies the source, catalogued as VLSS J0318.9+5755, as a radio phoenix: aged material from earlier black-hole activity that has become radio-bright again. Its radio spectrum falls exceptionally rapidly at higher frequencies, with spectral indices exceeding four in some regions between 400 and 650 megahertz.
The proposed history is more qualified than the nickname. The authors suggest that merger-driven gas motions compressed, stretched and redistributed old plasma. They explicitly describe this as one possible scenario and say that reproducing the detailed shape would require dedicated simulations. In their interpretation, mixing motions primarily shape the structure; it is not simply a tracing of shock surfaces. A possible surrounding radio halo also remains a candidate rather than an established detection.
Why faded plasma can brighten again
The physical idea predates this object’s new analysis. In work published in 2001, Torsten Enßlin and Gopal-Krishna modeled how fossil radio plasma could be revived by compression. Their calculations followed electrons through expansion, energy losses and later contraction after a radio galaxy’s central engine had stopped supplying the material.
Under suitable conditions, compression associated with the growth of cosmic structure could make even very old plasma visible again. The model predicted diffuse sources with exceptionally steep radio spectra, particularly accessible at low observing frequencies. This is a theoretical explanation for a population of objects, not a measurement of the Treble Clef’s individual past. Its value here is to explain why an old outflow need not simply disappear forever.
One image does not settle the mechanism
A useful comparison comes from a 2017 study of gently reenergized electrons in Abell 1033. That research examined a radio tail whose electrons appeared to receive enough additional energy to counter their losses. It also emphasized that identifying radio phoenixes by shape alone is uncertain: spectral and polarization information can help distinguish misleading lookalikes.
The comparison does not mean Abell 1033 and the Treble Clef share an identical mechanism. It shows why the broader scientific problem remains active. Astronomers must determine not only where radio-emitting material lies, but how its particles acquire, lose and regain energy in a moving environment.
The useful takeaway is therefore an evidential hierarchy. A memorable outline draws attention. Measurements across wavelengths establish the environment and particle behavior. Models then connect those measurements into a possible history. Keeping those steps separate makes the Treble Clef more interesting: it becomes a test of how cosmic collisions recycle old material, with important parts of the reconstruction still open to scrutiny.
Reporting checked October 14, 2026. Original explanatory graphic: Dark Fires, based on Botteon and colleagues and NASA/Chandra. It is a conceptual summary, not a telescope image or simulation.
A pale, comet-like object over western Pennsylvania on October 13 prompted UFO reports, but the emerging explanation points to a documented space launch. Researcher Stan Gordon attributed the sightings he received to SpaceX’s CRS-35 mission. A NASA image article published October 14 independently confirms that the mission produced sunlit exhaust plumes visible across the eastern United States.
The distinction matters: NASA has documented the launch and its widespread sky display. Gordon made the identification of the Pennsylvania reports. The agency’s account does not say it investigated those particular witnesses.
Two reports, one short window
In his October 13 account, Gordon describes a driver in Westmoreland County who saw a white-blue, gaseous-looking object over the Arona area at approximately 6:40 a.m. The observation lasted several seconds. Another report involved two witnesses between Luxor and Crabtree, also in Westmoreland County, who described a comet-like appearance and took two photographs.
Gordon says the pictures led him to recognize a launch-related event, resembling earlier reports he had encountered. That is an investigator’s assessment of witness descriptions and photographs, rather than a published trajectory reconstruction.
The independent launch record
NASA’s launch report puts liftoff at 6:33 a.m. EDT on October 13 from Space Launch Complex 40 at Cape Canaveral Space Force Station. A Falcon 9 carried Dragon and more than 6,300 pounds of science and cargo toward the International Space Station. Dragon separated from the second stage about nine minutes after launch.
The reported Pennsylvania observation therefore falls roughly seven minutes after liftoff. That timing is consistent with an ascent-related sighting, although timing alone cannot establish precisely what an observer saw.
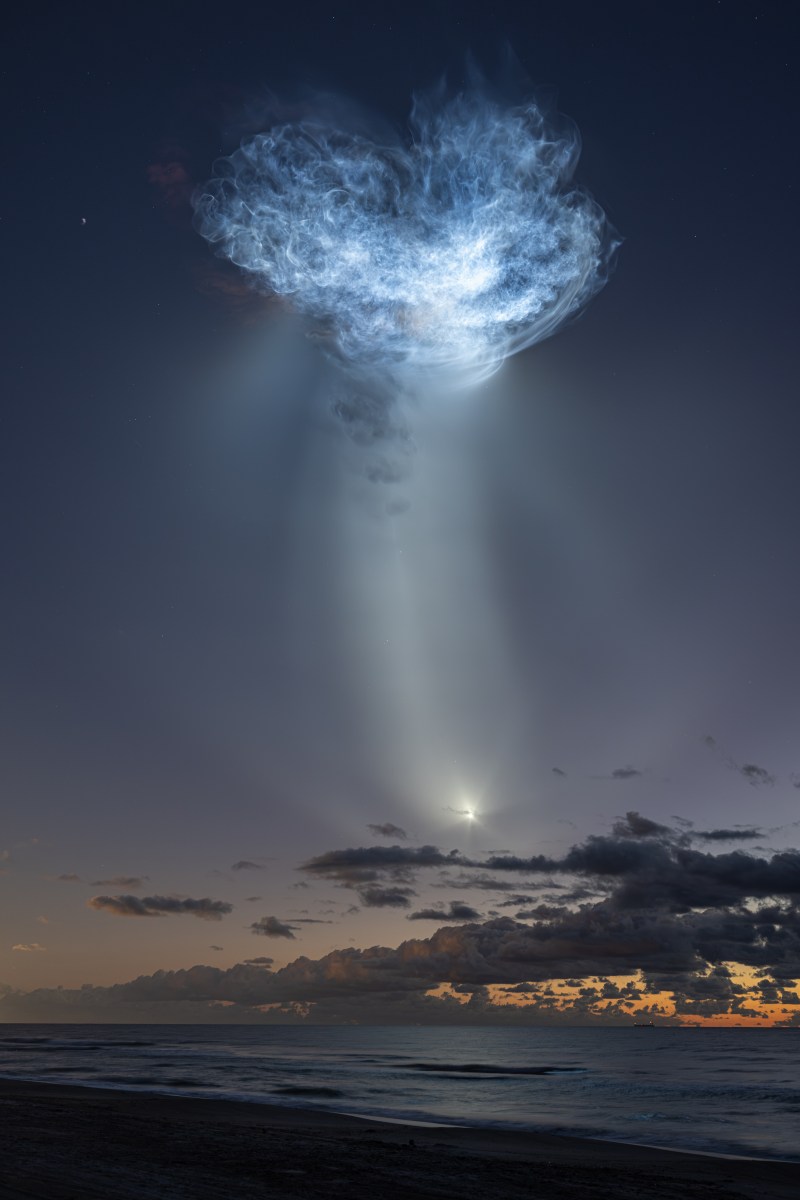
More importantly, NASA’s October 14 image article identifies a bright “jellyfish” display from this specific launch and says its exhaust plumes were visible across the eastern United States. This supplies independent regional context for the proposed explanation, beyond the fact that a rocket happened to launch that morning.
NASA’s October 13 launch photograph, shown uncropped. Credit: NASA/John Kraus. Not a Pennsylvania witness photograph.
Why an ordinary launch can look extraordinary
The lighting geometry explains much of the unfamiliar appearance. In a NASA explanation of a separate March launch, the high-altitude exhaust caught sunlight while the photographer remained in darkness. The illuminated exhaust appeared as a glowing cloud. Such conditions can occur around dawn or dusk.
That earlier example explains the mechanism; it is not additional evidence about the Pennsylvania witnesses. The October mission’s own NASA photograph documents the relevant kind of display on the relevant date.
What would make the identification more rigorous?
A useful next step would be a time-and-direction comparison using original photographs and the witnesses’ locations. The All-domain Anomaly Resolution Office’s information checklist emphasizes precise observer times, positions and travel paths, the phenomenon’s location and movement, other observers, and available sensor records.
For anyone documenting a similar sighting, a practical checklist is:
Record the clock and time zone. Note whether the time is exact or estimated, and when the observation began and ended.
Keep location and direction together. Where were you standing or traveling, and which way were you looking? Nearby landmarks can help reconstruct the view.
Preserve the original files. Keep photographs or video with their timestamps and other metadata, rather than relying only on a reposted clip.
Separate observation from interpretation. Record color, shape, duration and apparent movement before assigning a cause.
AARO’s public guidance also explains why uncompressed imagery, camera specifications and geolocation matter: they allow comparisons with known traffic and tracking databases, while compression can introduce artifacts.
The best-supported reading of this case is a plausible, independently corroborated launch explanation. It neither turns every unusual light into a rocket nor requires these reports to remain mysterious simply because the original view was startling. The useful work is connecting a particular observation to a particular event, while keeping the remaining limits visible.
Image: NASA/John Kraus. Sunlit exhaust from the October 13, 2026 CRS-35 launch. This NASA mission photograph is not an image supplied by the Pennsylvania witnesses. Reporting checked October 14, 2026.
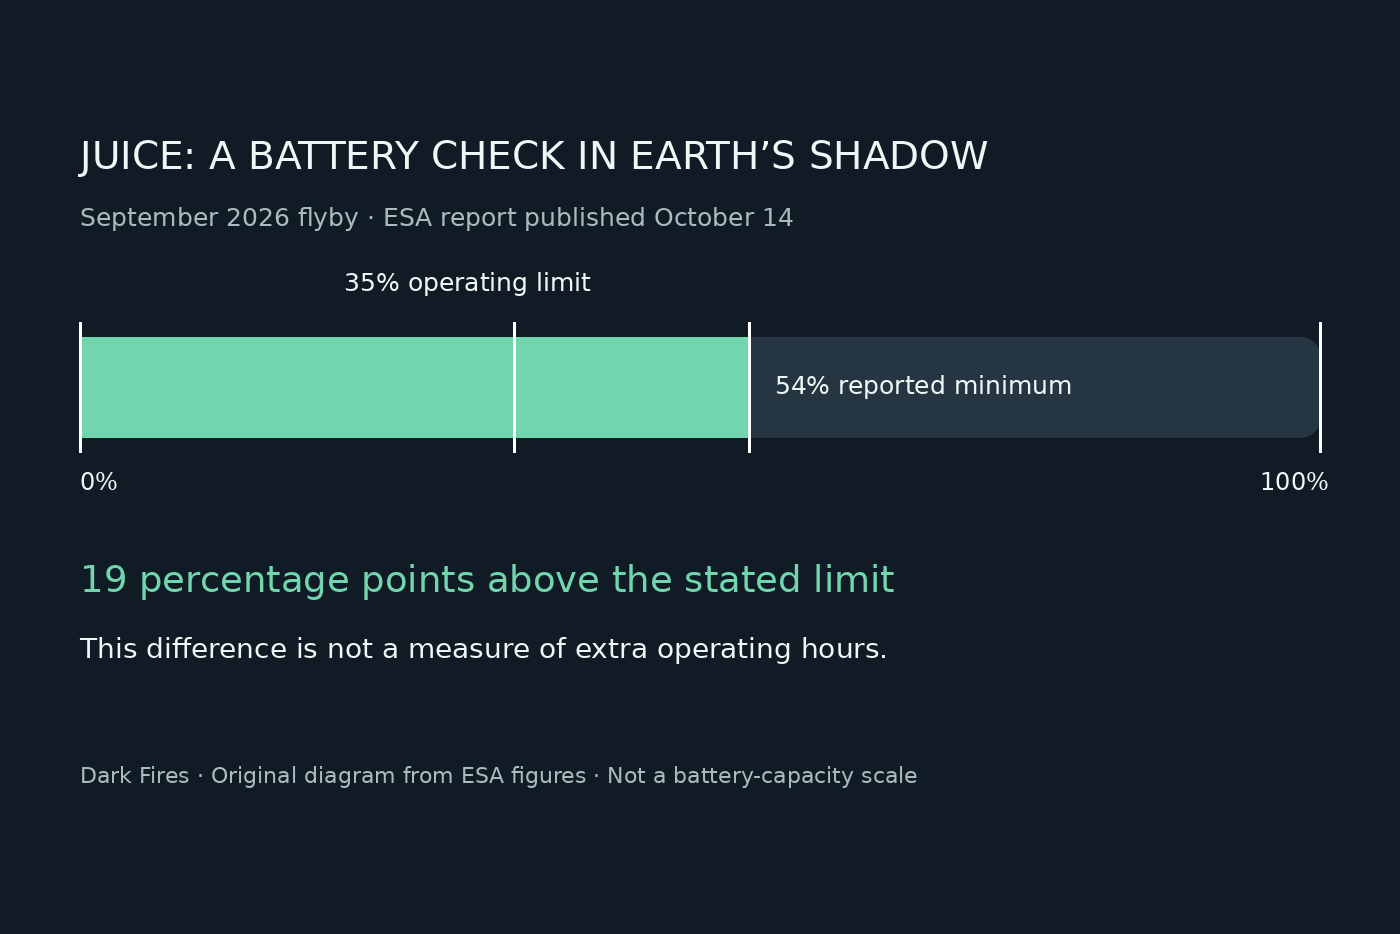
ESA’s October 14 account of Juice’s September 28 Earth flyby contains a more useful result than another beautiful view of our planet: a real test of how the spacecraft can keep working when sunlight disappears. The agency reports that Juice’s battery reached 54%, against an operational limit of 35%, during an eclipse that included three hours in full shadow. Several instruments kept operating. That is encouraging evidence for mission planning, with important limits on what can be inferred from it.
A margin measured in percentage points
The reported minimum was 19 percentage points above the stated operational limit. This is a subtraction of ESA’s two published figures, not an estimate of extra observing time. A battery reading alone cannot tell us how many more hours a spacecraft could safely run: that calculation would need the power demand, usable battery capacity, temperature and operating rules.
That distinction matters when reading an engineering success story. A spacecraft can finish a test with charge to spare while still facing a tightly constrained science schedule. The useful question is which instruments ran, for how long, under which conditions, and how closely the measured power use matched the team’s prediction.
Why so much solar panel produces so little power
ESA’s spacecraft specifications describe two wings totalling 85 square metres, with 23,560 solar cells and a span of 27 metres. Their size is a response to the weak sunlight at Jupiter. The specification gives approximately 850 watts for the spacecraft’s systems and instruments there. During an eclipse, even a large array cannot collect sunlight that is blocked.
The mission’s technical payload overview identifies a lithium-ion battery alongside the solar array, and gives approximately 820 watts for the array at Jupiter under end-of-life conditions. These figures have different stated contexts; they should not be treated as contradictory measurements from the September encounter. Neither is a direct measurement of the spacecraft’s total power consumption throughout that eclipse.
A rehearsal with a clear boundary
In its October 14 operations report, ESA says all ten science instruments contributed to the wider flyby campaign, not that all ten operated together in darkness. The encounter also exercised EAGLE navigation software, which uses camera images of a moon’s illuminated edge. Analysis of that navigation test remains pending. At Jupiter, eclipses can last up to five hours.
Our assessment: the battery result validates a particular flight experience, not every future observing sequence. Five hours is longer than three, but simply scaling the reported battery drop would be misleading. Different instrument combinations and thermal conditions could change demand. The next useful evidence would be a comparison between the flight measurements and updated power simulations, followed by a defined observing plan for longer eclipses.
The flyby had a second job
The encounter was also part of Juice’s route to Jupiter. ESA’s September 21 preview explained the trade: planetary gravity assists reduce the fuel needed to reach the destination and preserve propellant for later orbital manoeuvres. It scheduled instrument observations of Earth and the Moon between September 23 and October 3, giving teams known targets against which to calibrate their instruments and analysis methods.
The mission overview lists a final Earth flyby in January 2029 and arrival at Jupiter in July 2031. Juice is intended to examine Jupiter, Ganymede, Callisto and Europa, including the moons’ potential as habitats. This week’s engineering account does not report a discovery of life or a new ocean detection. It describes part of the practical work needed to obtain reliable measurements when the spacecraft arrives.
What to watch next
Power: whether updated models reproduce the measured battery behaviour and cover longer eclipses.
Navigation: the eventual EAGLE test analysis, rather than assuming that running the software established its accuracy.
Science planning: which instruments can operate together within the available electrical and thermal limits.
Those are concrete milestones. A successful rehearsal is valuable because it replaces some assumptions with flight data, while making the remaining assumptions easier to identify.
Reporting checked October 14, 2026. Diagram: Dark Fires, based on the two battery percentages in ESA’s October 14 operations report. The graphic does not show battery capacity or endurance.
Jay Stratton’s Out of the Shadows is out, alongside an October 13, 2026 PEOPLE interview. The former UAP Task Force director recalls viewing a classified video in 2005 of a triangular object near a nuclear missile site. That account does not independently authenticate the footage.
PEOPLE also describes an alleged submarine operation to attract a UAP. A representative says 21 agencies and departments reviewed the memoir before release.
What publication clearance means
The relevant distinction is explicit in Intelligence Community Directive 711, dated July 12, 2024. It defines prepublication review as a process for protecting classified government information, and separates it from declassification or official acknowledgment. Section D.1 says approval does not imply endorsement, authentication or official acknowledgment by the Intelligence Community or the U.S. government.
The directive covers non-official works by current and former personnel with relevant classified access, including books and interviews. It also provides for coordination among agencies. Multiple reviews can therefore reflect different agencies’ responsibilities for protecting information. The number of reviewers, considered alone, is not a measure of the evidence supporting an author’s conclusions.
The evidence question remains open
The Pentagon’s published position also remains important context. In its February 2024 historical report, AARO said it had found no empirical evidence supporting government or corporate reverse-engineering of extraterrestrial technology. The report treats witness accounts as potential starting points for investigation and says final assessments require provable facts. Its conclusions are agency assessments, not a case-specific rebuttal to every subsequent allegation.
For readers evaluating the new account, the useful distinction is between identifying an investigable event and establishing its cause. Original recordings, dates, sensor information, contemporaneous reports and independently assessable corroboration would help test an extraordinary interpretation. A witness’s seniority can make an account important to examine; it cannot, by itself, establish an object’s origin.
Dark Fires previously covered the memoir’s television adaptation. The new interview moves the discussion to specific reported events, where the quality and availability of supporting records become the central questions.
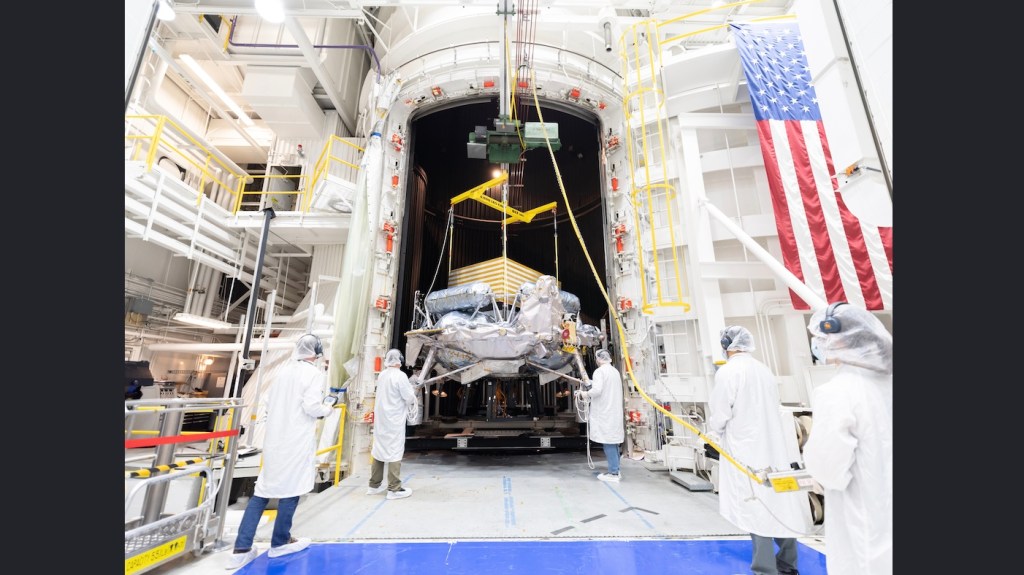
Voyager Technologies’ Griffin-1 lunar lander has completed environmental testing at NASA’s Jet Propulsion Laboratory and returned to Pittsburgh for final assembly. The 13 October 2026 update marks progress toward a planned launch later this year.
The campaign checked the spacecraft’s response to vibration, launch noise, electromagnetic interference and the vacuum and temperature extremes of space. Engineers also measured its mass properties, which help characterize how the vehicle will move.
Griffin-1 is intended to carry ten science and technology payloads to the lunar south-polar region, including Astrolab’s FLIP rover. Launch-readiness work and shipment to Cape Canaveral remain ahead.
Why the lander now carries Voyager’s name
Readers who followed Griffin as an Astrobotic mission are following the same developing programme. In a 13 July announcement, Voyager reported that it had completed its acquisition of Astrobotic. The lunar business now operates as Voyager Lunar Systems.
That earlier announcement placed Griffin-1’s launch no earlier than November 2026. It also described separate future lunar delivery work. Those later contracts should not be confused with the spacecraft that has just finished this test campaign.
A step toward delivery
The mission belongs to Commercial Lunar Payload Services, NASA’s initiative for working with American companies to transport scientific, exploration and technology payloads to the Moon. Commercial delivery vehicles are an important part of that approach: instruments need both a ride and a working platform at their destination.
Successful ground tests reduce uncertainty about how flight hardware will behave. They cannot guarantee a launch or landing outcome. Griffin-1’s next milestones will test whether the programme can turn that preparation into a completed lunar delivery.
Earth’s magnetic environment is constantly shaped by the solar wind. A new modeling study helps explain why waves along its outer boundary can become much stronger on one side than another, even when the incoming conditions are held steady.
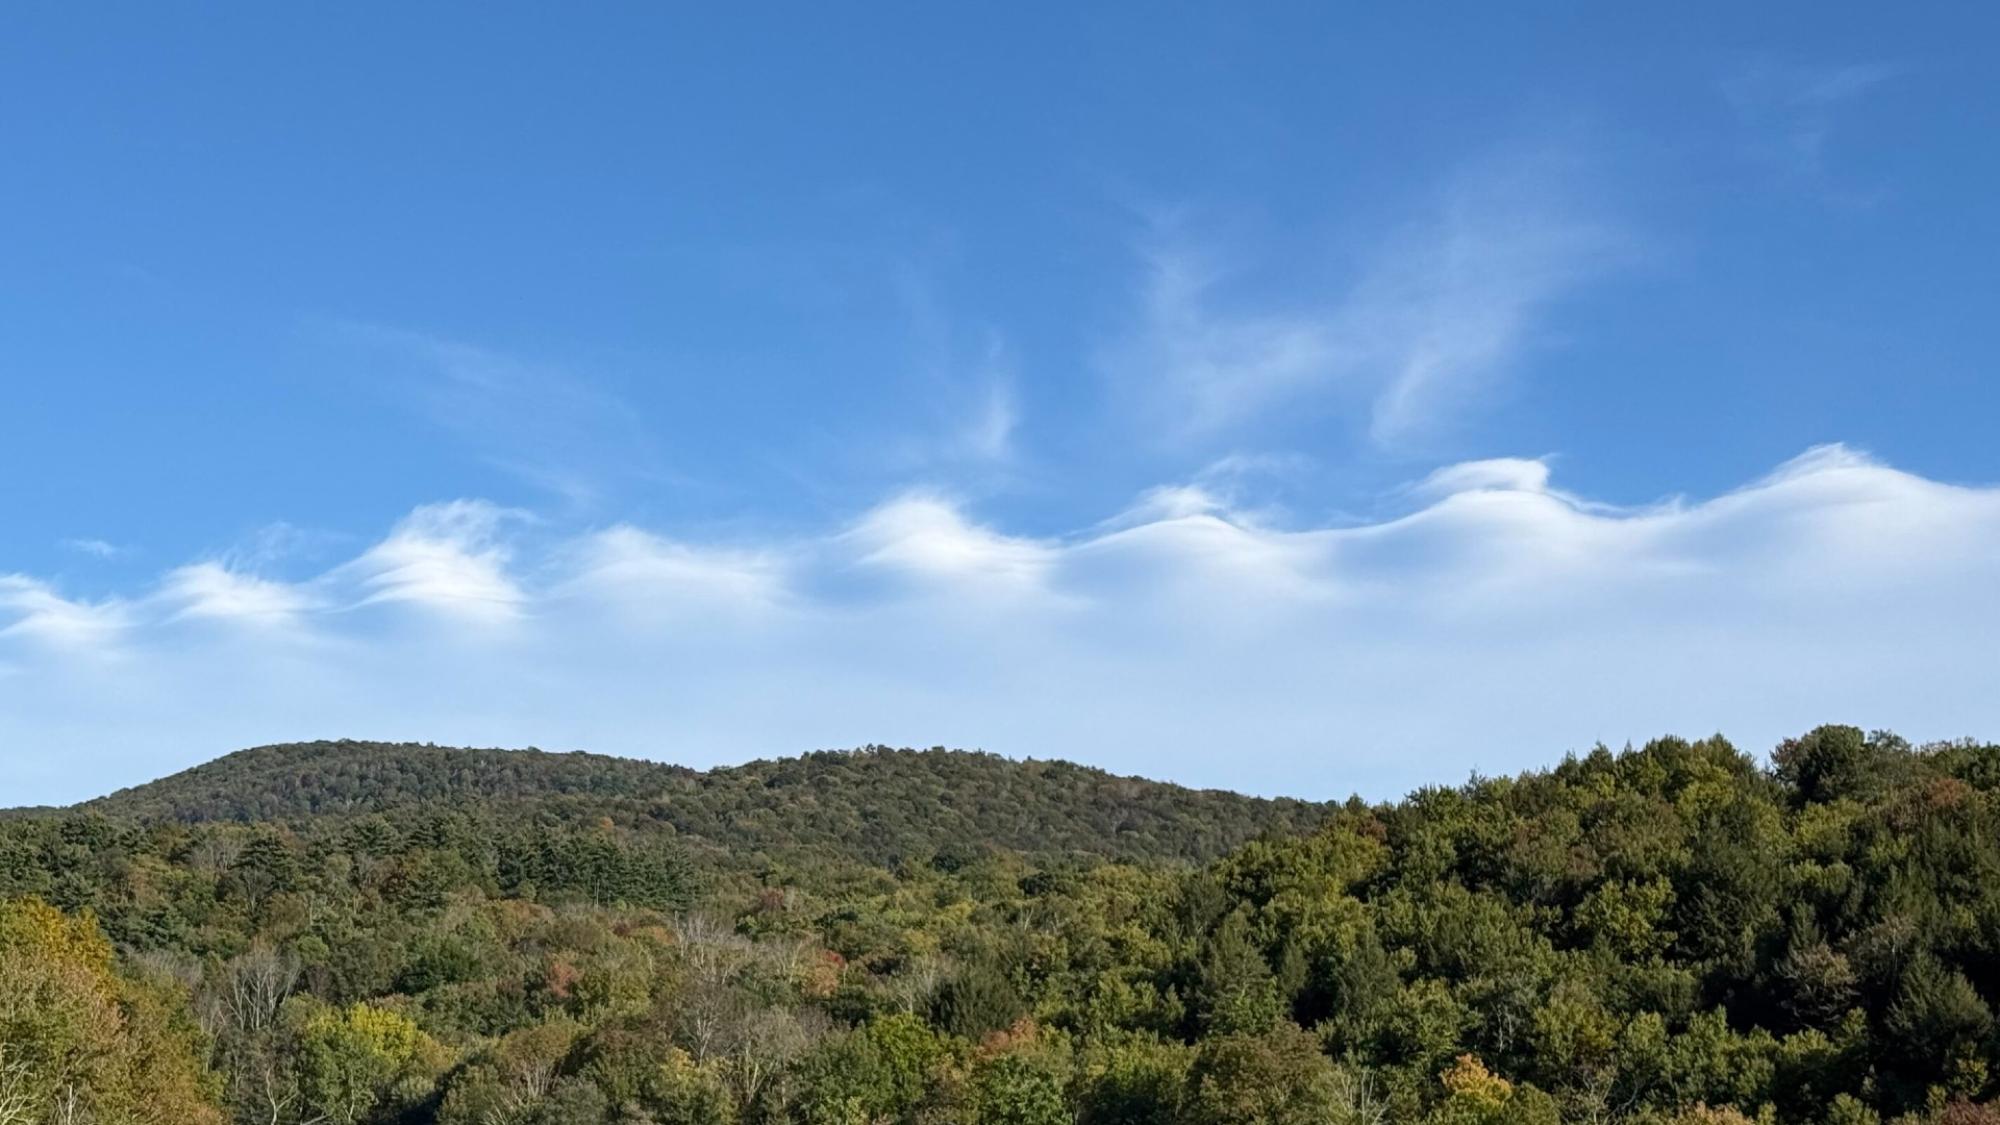
Kelvin–Helmholtz waves can also appear in clouds. This terrestrial example illustrates a related instability, not the simulated magnetosphere. Credit: Famartin, CC BY-SA 4.0, via Wikimedia Commons; cropped by University of Oulu. Image source · Usage terms.
In an October 13 announcement, researchers at the University of Oulu described how the solar wind’s magnetic field wraps unevenly around the magnetosphere. That draping changes how effectively the field suppresses boundary waves in different regions.
The waves arise through the Kelvin–Helmholtz instability, familiar in the curled shapes sometimes seen in clouds. At Earth’s magnetopause, the relevant flows are plasmas interacting along the boundary between the solar wind and the planet’s magnetic surroundings. Understanding the pattern matters because this boundary participates in the exchange of material and energy with near-Earth space.
Testing the geometry in a computer model
The peer-reviewed paper, first published September 16 in Geophysical Research Letters, used a global magnetohydrodynamic model to compare two controlled scenarios. The researchers reversed the east–west component of the incoming magnetic field while keeping other solar-wind inputs the same.
The simulations used a negative 35-degree tilt of Earth’s magnetic dipole. Under the tested conditions, wave activity was strongest in the winter hemisphere. A positive east–west magnetic component favored the dawn flank. Differences in flow speed across the boundary and in the draped magnetic field helped explain the uneven growth.
Magnetic reconnection geometry also mattered: in the positive-component case, a broader boundary layer on the dusk side slowed the instability. The result links several pieces of the system rather than assigning the asymmetry to a single factor.
These findings concern specific modeled conditions, so they should not be read as a universal rule for every solar-wind encounter. Nor are they an alert that Earth’s magnetic protection is suddenly failing. Their value is more precise: they give researchers a physical explanation to test when improving models of how the Sun and Earth exchange energy.
A rapidly brightening point of light in a distant galaxy may be giving astronomers a glimpse of a stellar explosion only days into its development. Researchers using the James Webb Space Telescope’s NEXUS survey describe the source, AT 2026abck, in a preprint posted September 29.
A false-color Webb image marks the location of AT 2026abck with a white cross. Credit: Ming-Yang Zhuang et al. (2026), Figure 4, CC BY 4.0. Image source · Usage terms.
Webb detected the transient on August 7 in a galaxy with a measured redshift of 5.017. Its light is hot and rich in ultraviolet emission, and its position away from the galaxy’s nucleus favors a core-collapse supernova, the explosive death of a massive star.
The team estimates that the source was seen about four to ten days after the explosion in its own rest frame. The interpretation remains a candidate classification rather than a spectroscopically confirmed supernova. Its inferred temperature and luminosity also exceed those of ordinary Type II supernovae at comparable early stages, leaving important details of the event unresolved.
Finding change by returning to the same field
The discovery builds on a survey designed to revisit the sky. In a separate September 7 report on NEXUS’s first year, the researchers cataloged 68 robust transient detections. Their search compared repeated infrared images of the north ecliptic pole region at intervals of roughly two months.
They obtained secure spectroscopic redshifts for 37 transients, helping establish where those events occurred. But the team also highlighted a limitation: the main search uses just two imaging filters, making it difficult to classify some very distant supernova candidates confidently. Detecting a change and identifying its cause are separate scientific steps.
The original NEXUS survey plan combines a wider imaging and spectroscopy area with a smaller, repeatedly observed deep field. Its goals include studying distant galaxies, active galactic nuclei and transient events, with processed data released publicly.
AT 2026abck illustrates the value of that repeated attention. A deep image records what is present; a sequence of deep images can reveal what appeared, faded or changed. In this case, that approach has produced an unusually distant explosion candidate whose nature now needs closer examination.
Half of the Sun is hidden from Earth at any moment, leaving an awkward gap in efforts to track its changing magnetic field. A Southwest Research Institute team has developed a way to improve those maps while screening out misleading signals from the unseen hemisphere.
A model and two observational reconstructions show far-side solar activity on January 10, 2012. Credit: Bibhuti Kumar Jha et al. (2026), Figure 1, CC BY 4.0. Image source · Usage terms.
The work, announced by SwRI on October 13, uses helioseismology: the study of waves traveling through the Sun. Those waves carry clues about magnetic activity beyond direct view. Some apparent active regions, however, turn out to be false detections, known as “ghost” regions.
Rather than treating every signal equally, the team assigns candidate regions a probability of being real. The aim is to improve surface flux transport models, which follow how magnetic activity changes across the solar surface. Such maps support research into solar cycles and the space weather that can affect Earth.
A clearer map, with a measurable trade-off
The research paper describes a comparison of helioseismic maps with STEREO ultraviolet observations collected between May 2010 and August 2014. Properties including magnetic flux, field strength and location help the method distinguish likely active regions from false signals.
At the selected threshold, 93 percent of regions classified as real were genuine in the evaluation sample, while roughly 90 percent of ghost regions were rejected. That precision comes with a trade-off: the method recovered about 52 percent of genuine regions in the same test. It is a selective filter rather than a complete inventory.
The authors also found that their conventional, near-side-driven simulations missed roughly 10 to 20 percent of the Sun’s total unsigned magnetic flux compared with the far-side-informed reconstruction. Incorporating the additional information produced more realistic magnetic evolution across successive rotations.
The immediate result is a better-supported input to solar modeling. It does not mean the team can now predict every flare or Earth-directed eruption. Turning improved magnetic maps into dependable warnings still requires the other physical models and observations used in space-weather forecasting.
Artemis III has reached another assembly milestone at Kennedy Space Center. In an October 13 progress update, NASA reported that its teams have finished stacking the Space Launch System rocket’s solid boosters and installed all four RS-25 engines on the core stage.
Artemis III’s solid rocket boosters inside Kennedy Space Center’s Vehicle Assembly Building on September 30, 2026. Credit: NASA/Cory S Huston. Image source · Usage terms.
The next major assembly step is to connect the core stage to the boosters, producing a shortened configuration for a propellant-loading test. Before that, workers will install a tunnel along the core stage that carries pyrotechnic wiring. NASA expects the combined hardware to travel to Launch Pad 39B in the coming months.
The test will let the launch team practice loading propellant and following the associated procedures and timelines. The four-person crew will also rehearse parts of launch day, including suiting up, traveling to the pad and walking the emergency exit route. These are preparation activities; the update does not announce a launch date.
An Earth-orbit rehearsal for future lunar landings
The destination is important. NASA’s current Artemis III mission description places this flight in low Earth orbit, with launch planned for 2027. Its purpose is to demonstrate systems needed for later lunar landings, beginning with Artemis IV.
SLS will launch the astronauts aboard Orion. The planned work includes rendezvous and docking demonstrations with one or both commercially developed human landing systems. Those landers are being developed to carry astronauts between lunar orbit and the Moon’s surface on subsequent missions. Artemis III gives the program an opportunity to evaluate critical operations close to Earth before attempting them farther away.
That context explains why a ground milestone matters. Rocket assembly, propellant handling and crew procedures must become a coordinated sequence before the mission can test spacecraft working together in orbit. The completed boosters are a tangible step in that sequence, while the upcoming tanking rehearsal remains a separate test still to be carried out.