DARK FIRESORIGINS UNKNOWN

Author: Dark Fires

  • SPHEREx Reveals Brown-Dwarf Chemistry That Challenges Atmosphere Models

    SPHEREx Reveals Brown-Dwarf Chemistry That Challenges Atmosphere Models

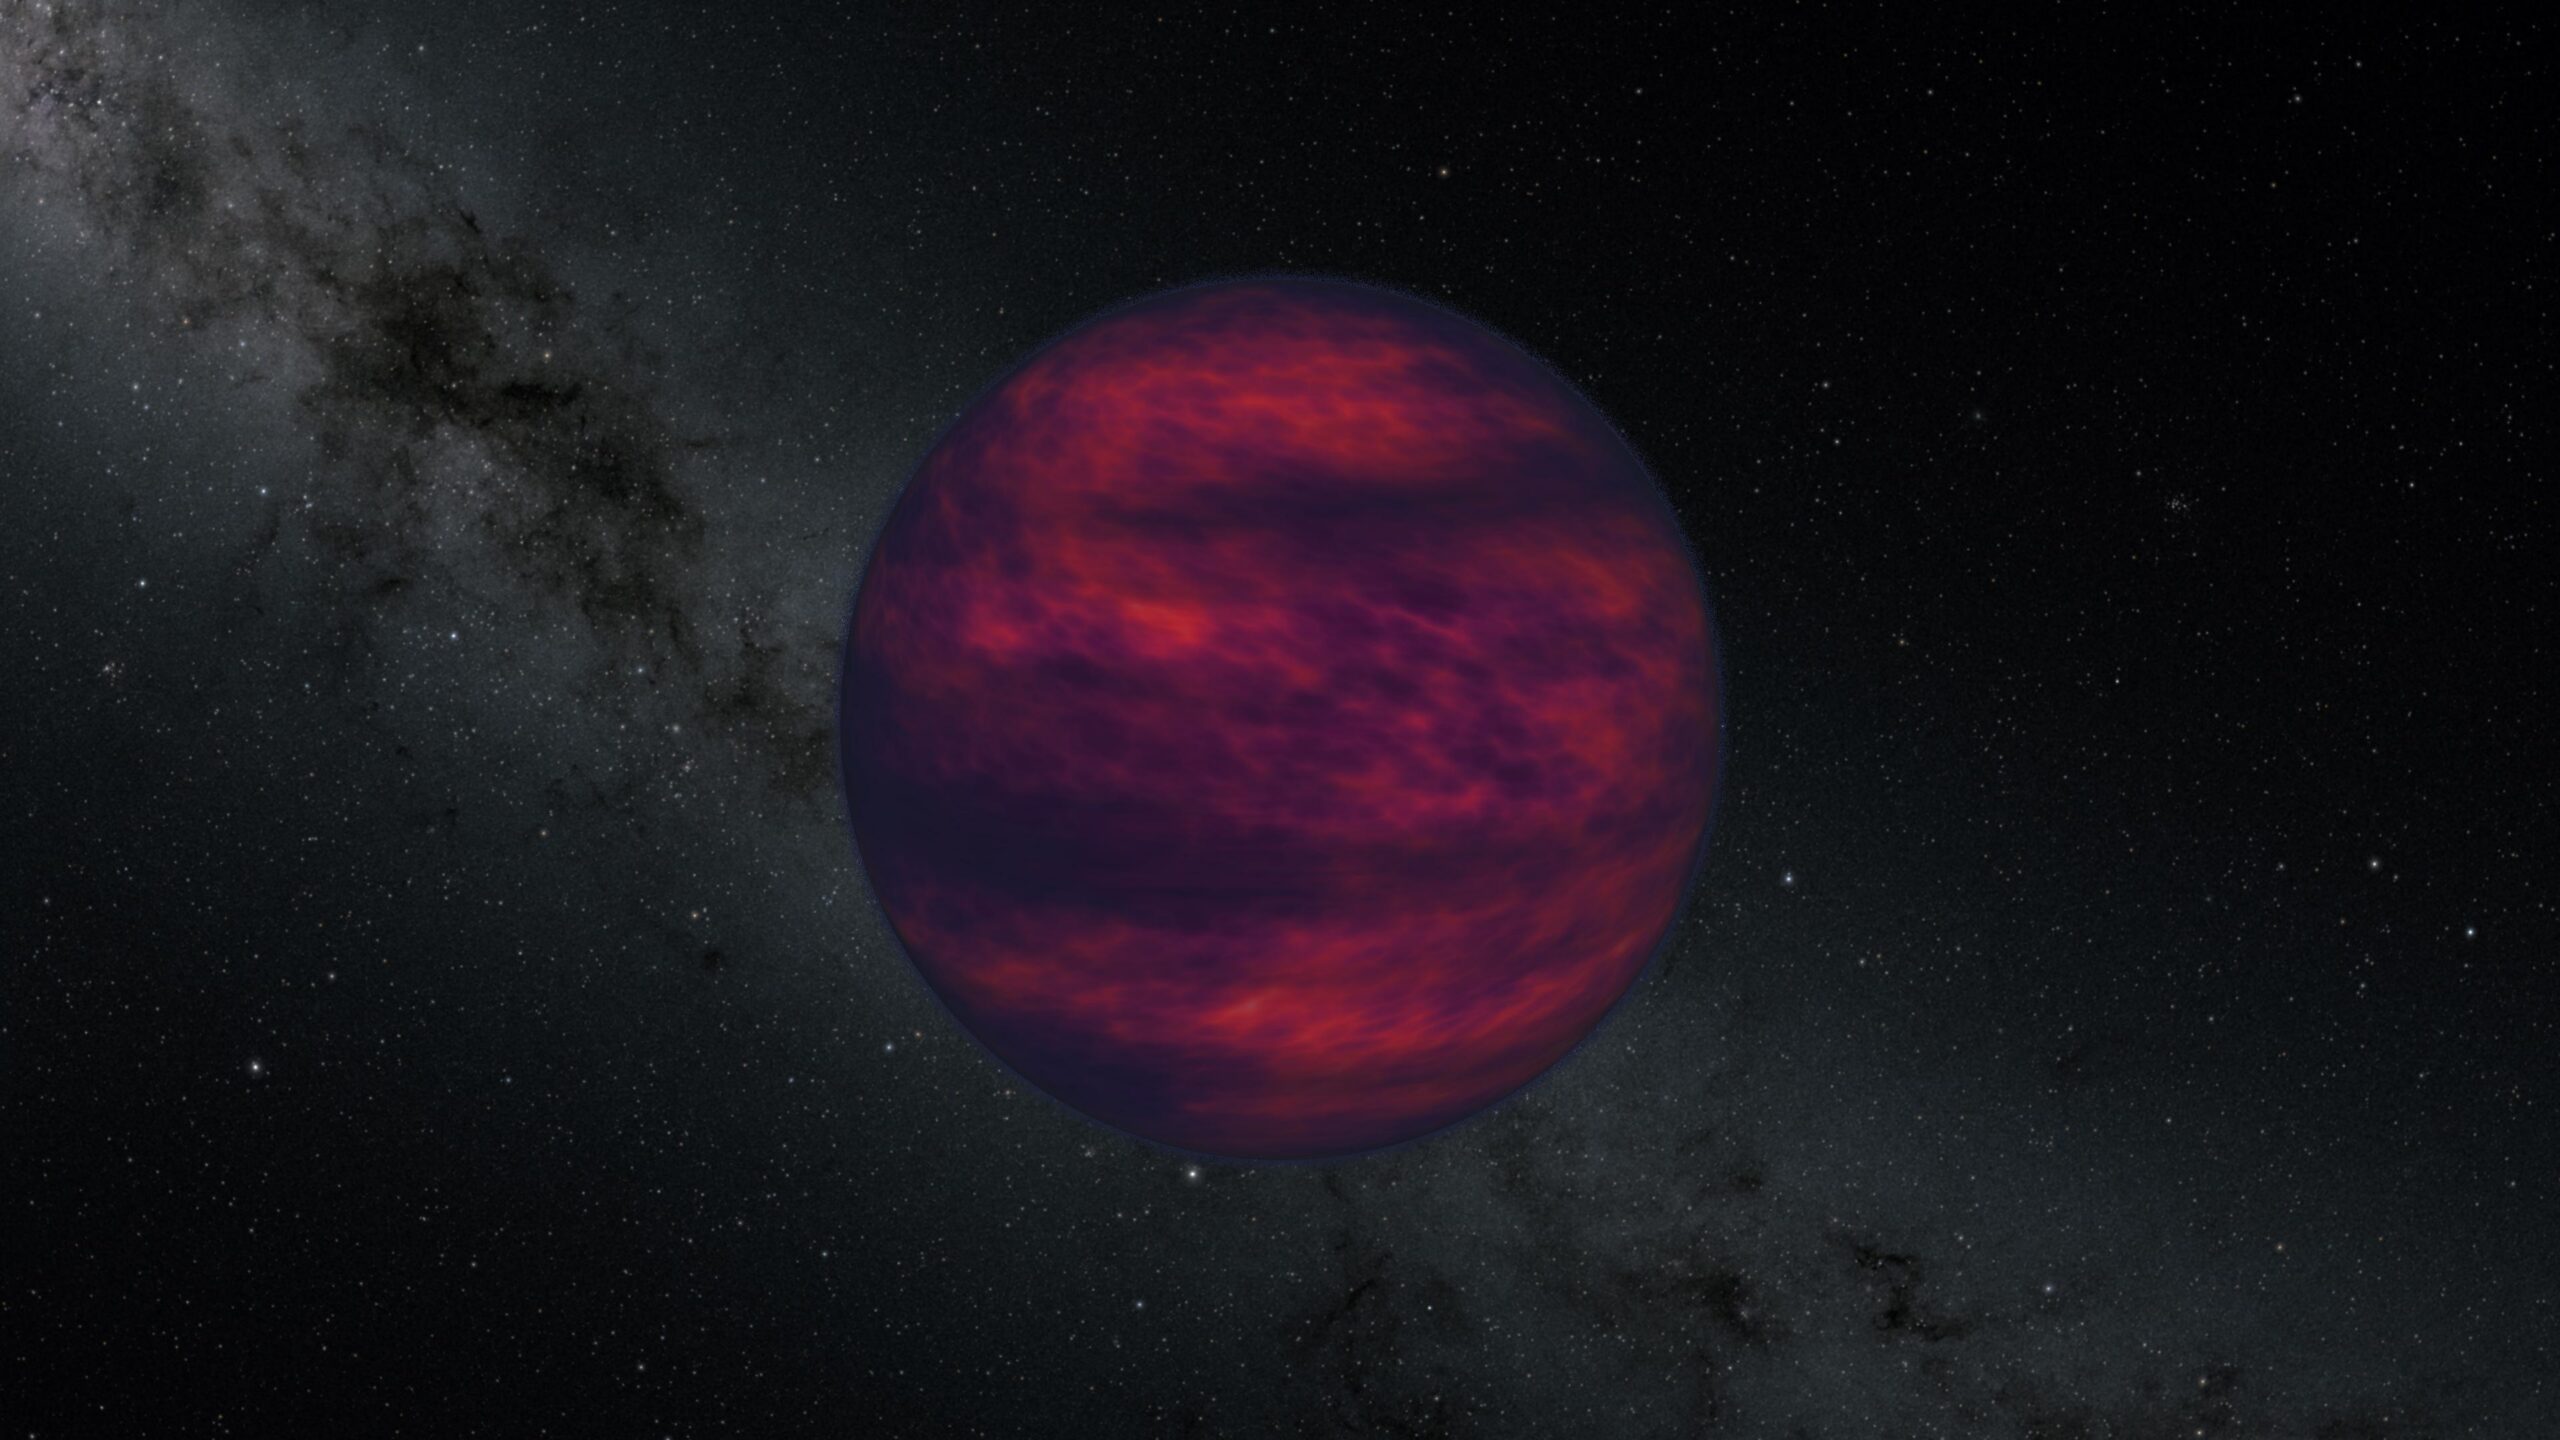
    Artist’s concept of a brown dwarf. SPHEREx is measuring the light of these faint objects to investigate their atmospheres. Credit: NASA/JPL-Caltech.

    NASA’s SPHEREx space telescope is turning the faint glow of brown dwarfs into a test of atmospheric science. An October 8 announcement describes observations revealing water, carbon dioxide, carbon monoxide and methane in these dim objects, alongside a challenging result: leading models still cannot reproduce all the details of their light.

    The study, led by Zafar Rustamkulov, examines a sequence of nearby brown dwarfs spanning spectral classes L0 through Y4 and temperatures of roughly 2,500 to 250 kelvin. Its July preprint preceded publication in The Astrophysical Journal on September 28. This week’s news brings the results to a wider audience.

    Reading the light of dim worlds

    Brown dwarfs form through the collapse of gas but lack enough mass to sustain the hydrogen fusion that powers ordinary stars. Their atmospheres can nevertheless resemble those of giant planets. The free-floating objects discussed in NASA’s announcement radiate their own heat as they gradually cool.

    Reading that light requires spectroscopy. A normal image compresses much of an object’s information into its apparent brightness and color. A spectrum separates the light by wavelength, exposing patterns that different materials leave behind. As NASA’s spectroscopy explainer describes, those patterns let researchers investigate composition and temperature without collecting a physical sample. The result is a set of chemical clues that can be compared with predictions for a model atmosphere.

    Where the models fall short

    The researchers compared their measurements with several established atmosphere-model families. The calculations broadly followed the changing chemistry, yet had trouble matching different wavelength regions simultaneously. Problems were especially pronounced around the L/T transition, with large discrepancies near carbon dioxide and carbon monoxide features. Within the Elf Owl model family, the sample favored weaker vertical mixing over stronger mixing, offering a specific direction for further testing.

    The cloudy transition is important because cooling can change both what an atmosphere contains and how easily light escapes it. NASA’s account describes thinning clouds and increasingly methane-rich atmospheres. Even objects with similar temperatures can produce noticeably different spectra, complicating the task of making a single model fit them all.

    Water and carbon-bearing molecules may sound familiar from discussions of habitable planets. Here, however, their detection describes atmospheric chemistry; the study makes no claim of life. Finding a molecule and establishing a biological origin are separate scientific questions. Readers should also avoid treating a water signature as evidence for an ocean or an Earth-like surface.

    A growing comparison sample

    SPHEREx was launched on March 11, 2025. Its planned two-year all-sky survey is designed to gather data on more than 450 million galaxies and more than 100 million Milky Way stars. Brown-dwarf research demonstrates how such a broad survey can also illuminate nearby objects that are difficult to characterize.

    The practical value of this work lies in comparison: observed spectra show where theoretical atmospheres succeed and where they need improvement. Expanding those tests to larger samples should help distinguish recurring physical effects from the peculiarities of individual worlds.

  • Webb Traces an Ancient Fast Radio Burst to a Young Dwarf Galaxy

    Webb Traces an Ancient Fast Radio Burst to a Young Dwarf Galaxy

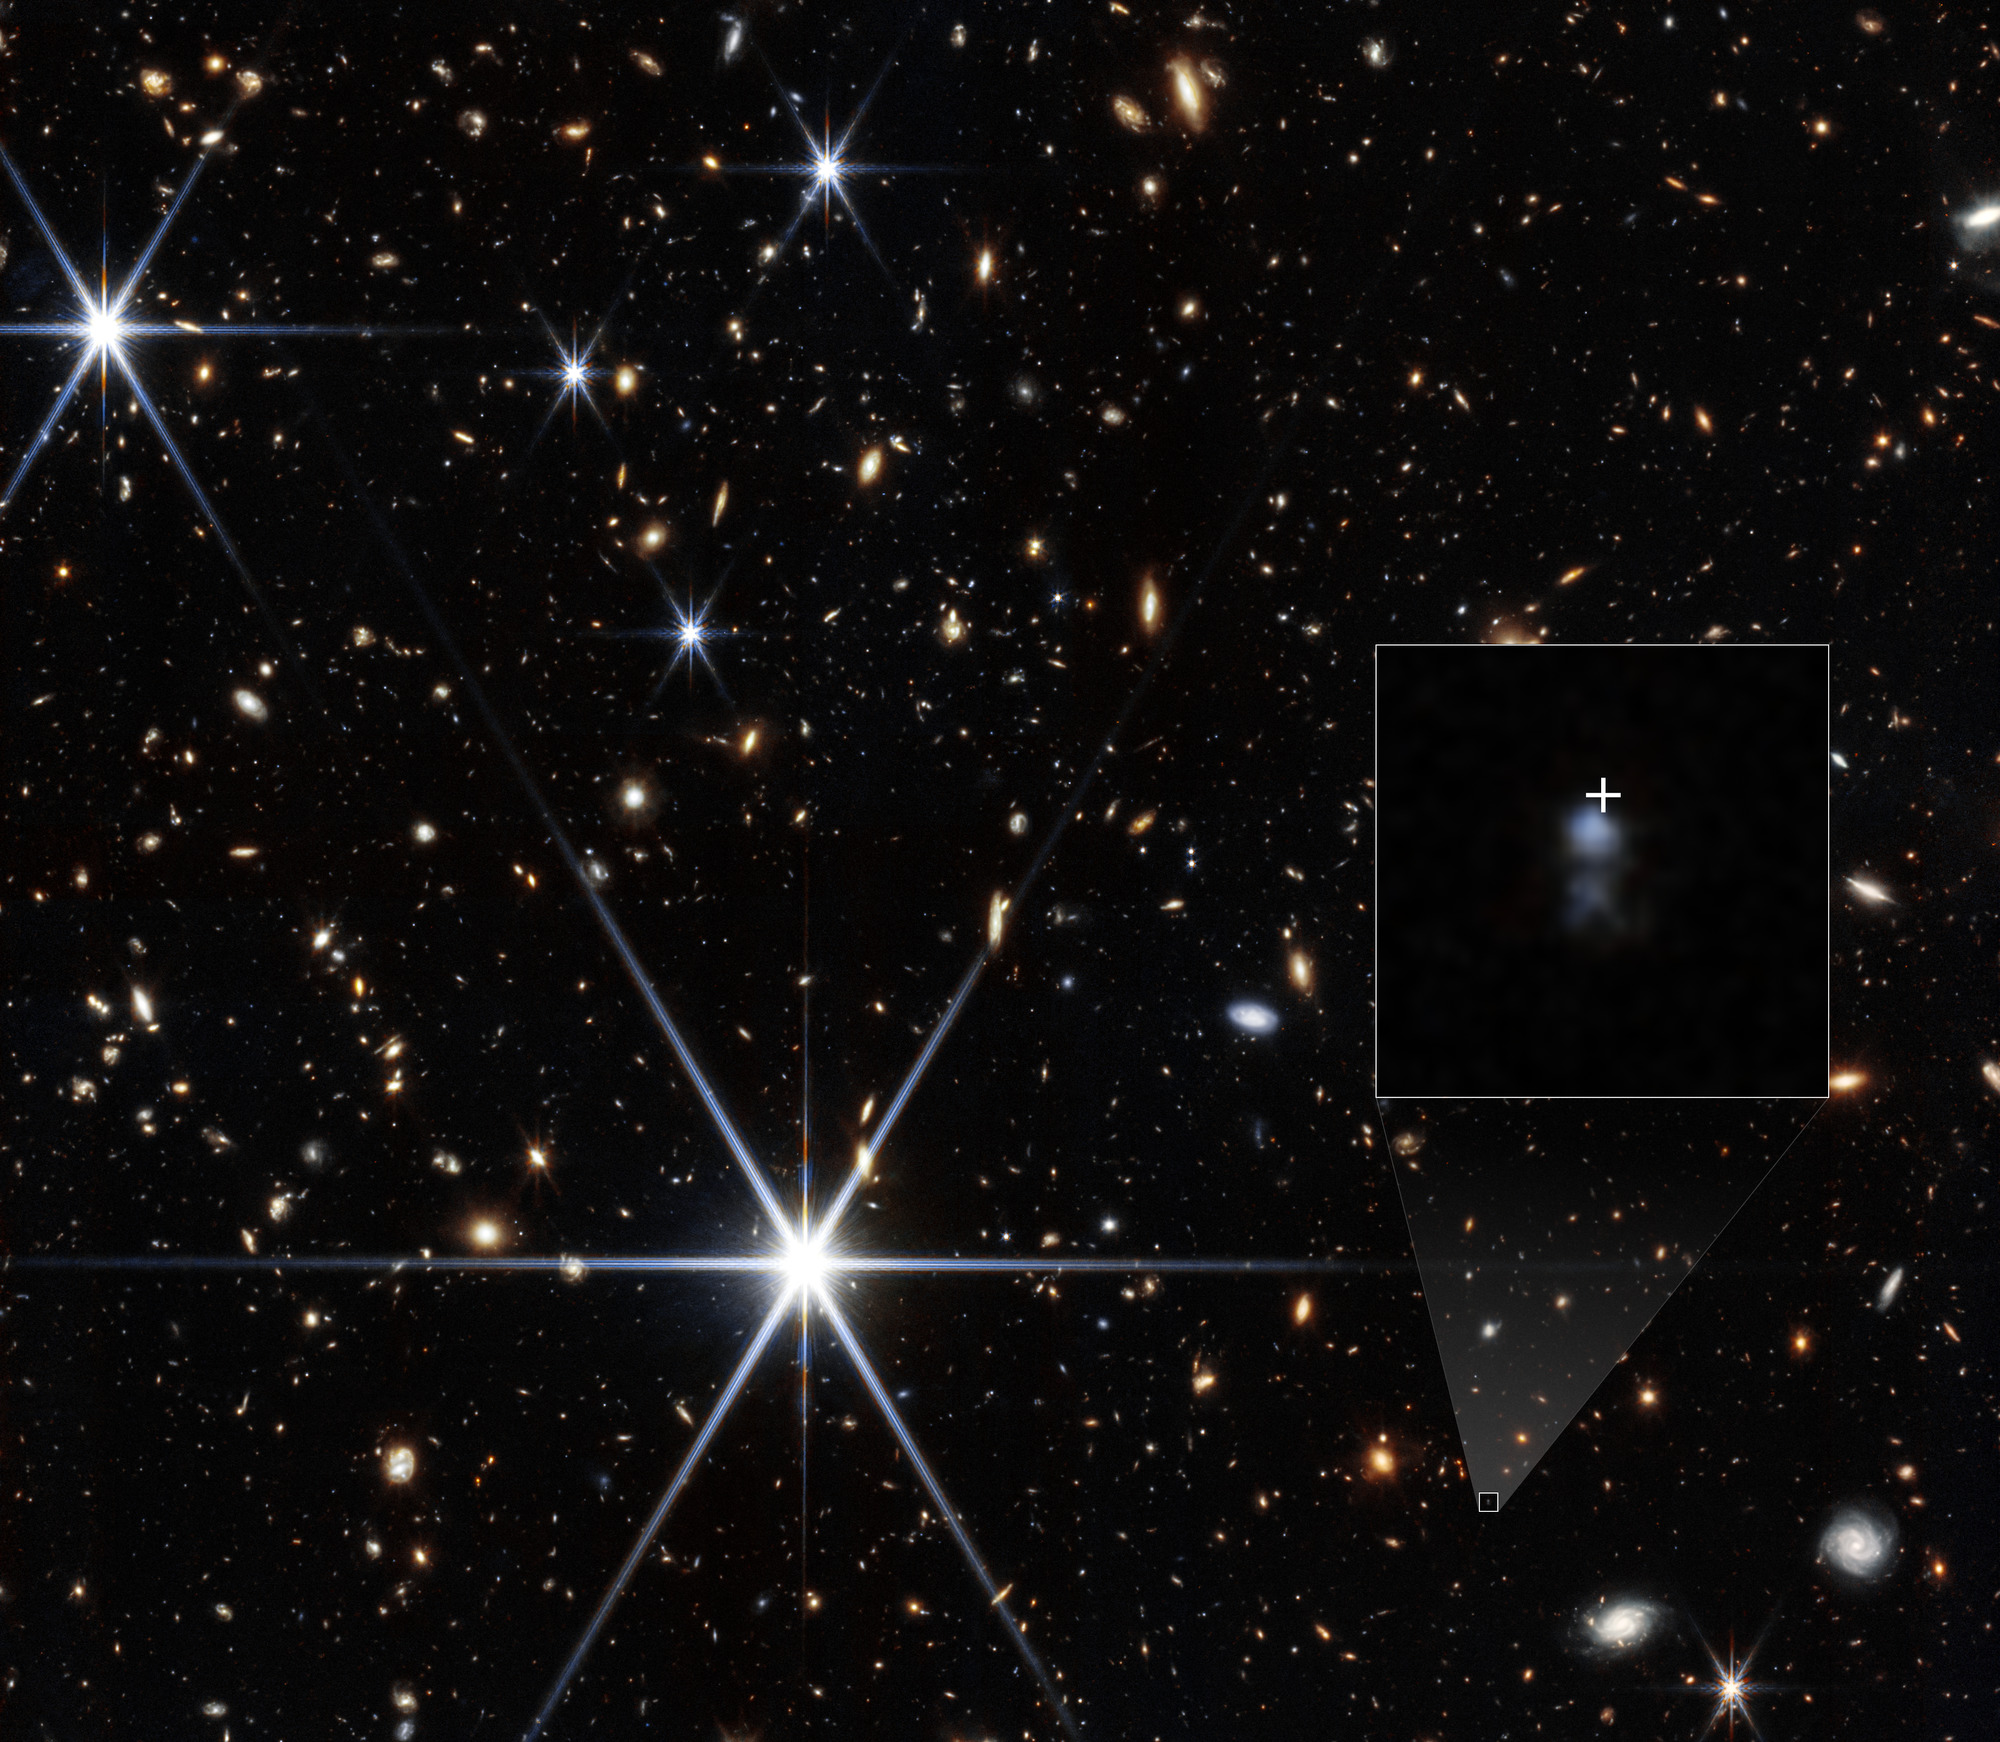
    Webb’s NIRCam view marks the location of FRB 20240304B near its dwarf-galaxy host. The infrared exposures were taken on December 26, 2024; the radio burst was detected in March 2024. Image: NASA, ESA, CSA, STScI, Themiya Nanayakkara (USYD); Image Processing: Joseph DePasquale (STScI).

    A radio flash lasting only milliseconds has given astronomers a view into a much younger universe. New research highlighted in an October 8, 2026 Webb release identifies the host of FRB 20240304B as a small, actively star-forming galaxy seen when the universe was about three billion years old.

    The chronology matters. South Africa’s MeerKAT telescope detected the burst on March 4, 2024, through the MeerTRAP project. A preprint appeared in August 2025; the new development is its publication in Science and the accompanying October 2026 research announcements. The burst was not first observed this week.

    A distance measured through its galaxy

    The radio observations gave the team a precise sky position, but ground-based telescopes could not reveal the host. Webb’s NIRCam found it, and NIRSpec measured a redshift of 2.148. The researchers describe it as the most distant fast radio burst yet identified with a host.

    Cosmological redshift records how much light has stretched while traveling through an expanding universe. Astronomers use that stretch, together with a cosmological model, to place an object in cosmic history. Comparing objects by redshift keeps the measured quantity separate from distance estimates, which also depend on the definition of distance being used.

    The released NIRCam image shows the host and marks the burst’s location. Its underlying exposures were taken on December 26, 2024. Readers are seeing the galaxy in an infrared observation taken after the radio event, rather than a photograph of the millisecond flash itself.

    A young environment narrows the possibilities

    The University of Sydney’s research announcement describes the galaxy as small, poor in heavy elements and undergoing vigorous star formation. That environment provides a clue about the object that produced the burst.

    One proposed source is a young magnetar, a neutron star with an exceptionally strong magnetic field, left behind after a massive star explodes. Another family of explanations involves older neutron stars merging. A youthful stellar population more naturally accommodates a source that becomes active soon after star formation than one requiring a long delay.

    That comparison favors a young-magnetar explanation for this event. It does not identify the individual object directly or establish that every fast radio burst has the same origin. The strength of the result comes from connecting a transient signal with a measured environment.

    The journey carries information too

    The authors’ preprint also describes the burst as a probe of ionized ordinary matter across roughly 80 percent of cosmic history. Its path intersects the Virgo Cluster and a more distant foreground group, allowing the signal to carry information about material between the source and Earth.

    Future bursts with securely identified hosts could extend that approach to other sightlines. Each adds two connected measurements: an energetic event in a particular galaxy, and a sample of the intervening universe. This result shows why finding the host can be as consequential as detecting the flash.

  • NUFORC Passes 200,000 Reports: How to Read a Growing UFO Archive

    NUFORC Passes 200,000 Reports: How to Read a Growing UFO Archive

    Editorial illustration: Earth from orbit. Dark Fires artwork; not a documented sighting.

    Archive guide | Updated 14 October 2026

    The National UFO Reporting Center says it received its 200,000th sighting report in August 2026, announcing the milestone on September 7. Built over 52 years, its collection grew from handwritten accounts into a public archive covering every U.S. state and much of the world. It is not a count of 200,000 independently verified objects, or necessarily 200,000 separate events.

    The most useful question is what a particular group of reports can establish. A careful reader can turn an intriguing cluster into a checkable research question without either dismissing witnesses or treating every description as a measurement.

    First, understand what the archive contains

    NUFORC’s database guide describes staff review and four tiers. Tier 1 highlights close-range accounts of apparently structured craft or especially anomalous phenomena. Tier 2 covers unusual reported behavior. Tier 3 contains other reports staff cannot readily explain. Tier 4 covers proposed human or natural explanations, graded possible, probable or certain.

    These are the organization’s assessments. Reports received before March 2023 have not yet been graded, so whole-archive tier comparisons would mix graded and ungraded material. NUFORC also disclaims guarantees about report validity and says most accounts appear substantially as submitted.

    Read the narrative, any explanation and supporting material together. A striking shape label is a starting point for comparison; it does not establish distance, dimensions or origin.

    Ten reports can mean very different things

    Consider two entirely hypothetical searches, each returning ten reports.

    • Search A: Ten entries describe a light crossing the same valley during the same five-minute interval. The reports may represent one event with several viewpoints. If two entries are resubmissions by one witness, there are fewer distinct accounts. If witnesses discussed the event before writing, agreement is not fully independent.
    • Search B: Ten people describe lights on ten separate nights. There may be ten events, but each has only one recorded account. Similar language does not establish that the same object or cause was involved.

    Neither set is automatically stronger. Search A might support a reconstructed path if locations and times are precise. Search B might suggest recurrence worth investigating. Keep three totals separate: records, candidate events and independently obtained observations. Preserve uncertain groupings rather than forcing an exact event count.

    A repeatable reading workflow

    1. Fix the question before choosing the cases. Try “What was reported from this county on these dates?” Record your geographic boundary, observation-date range, access date and inclusion rules. The archive offers event-date, state/country, shape and posting-date indexes. Start broadly enough to include differently described accounts of a possible shared event; searching only “triangle” can build the desired pattern into your selection.
    2. Keep the clocks separate. Full entries can distinguish when something occurred, when it was reported and when it was posted. For example, report 111 lists an observation on February 2, 1995, reporting the next day, and posting on November 2, 1999. A posting surge can therefore contain older observations. Retain the displayed time zone, mark approximate times, and do not silently equate local observation time with a reporting timestamp.
    3. Build a small evidence ledger. Save each report’s URL or identifier, place, dates, duration, witness count, description, media availability and editorial explanation. The submission form asks for approximate-date/time flags, viewing direction, elevation and estimated distance, size and speed, among other details. Record missing information as missing. Separate direct descriptions, estimates and independently supported measurements. Without a reliable distance, physical size and speed estimates remain uncertain.
    4. Group cautiously, then test the grouping. Compare nearby times, locations, directions and distinctive details. Mark possible shared events and duplicate submissions separately. Do not discard a different viewpoint merely because it concerns the same event. Recount using both narrower and wider time windows; if your finding changes sharply, disclose that sensitivity. Similar wording alone establishes neither copying nor corroboration.
    5. Ask what could distinguish explanations. NUFORC’s screening guidance flags familiar possibilities, including Starlink satellite trains. Check launch activity, satellite visibility, astronomical positions, weather and available aircraft records for the actual place and time. Log the source and coverage limits of each check. An empty aircraft search is not proof that no aircraft was present. For media, seek the original file and capture circumstances. NASA’s 2023 independent study emphasizes calibrated observations, contextual metadata and reliable distances for evaluating extraordinary-motion claims. An image alone can leave size, motion and identity unresolved.

    Before calling something a trend

    A cumulative total measures accumulated reporting. Even annual observation-date counts cannot, by themselves, measure how often unusual objects occur. Population-adjusted reports answer a different question from reports per hour spent watching the sky. A stronger occurrence comparison would need comparable observation exposure, geographic coverage and detection conditions, plus an account of changing willingness and ability to submit reports. Late submissions also leave recent periods less complete.

    Without those denominators, describe the result narrowly: more reports in the selected archive and period, under stated counting rules. A useful conclusion identifies what is supported, what remains uncertain and which missing observation could resolve it. Revisit the assessment when new evidence appears. Preserving that distinction makes the archive more valuable, whatever explanation a future investigation finds.

    Follow the evidence further

    For recording-specific checks, use our UAP video evidence checklist. To see what measured distance changes, read our analysis of Galileo’s three-site study. Our GEP September roundup provides another example of how submission dates, sighting dates and case status answer different questions.

    Update note, 14 October 2026: Expanded this guide with a reproducible evidence ledger, an explicitly hypothetical report-count comparison and checks for clustering and incomplete grading.

  • Galileo’s Three-Site Study Puts Distance Into the UAP Search

    Research explainer | Updated 14 October 2026

    A bright dot crossing a video can look extraordinary while leaving its physical speed unknown. The missing quantity is often distance. The Galileo Project’s three-site study offers a useful way into that problem: compare reconstructed motion with aircraft whose positions are independently reported, then ask what the measurement can actually establish.

    What the aircraft test showed

    The September 24, 2026 manuscript describes three stations near Las Vegas, each carrying eight long-wave infrared cameras. It analyzes May 24–30, 2026. Its arXiv record, submitted October 2, still describes the work as submitted to Sensors; the linked manuscript does not establish peer-reviewed publication.

    Against Automatic Dependent Surveillance–Broadcast (ADS-B) aircraft records, 588 of 593 three-site distance estimates fell within five percent of the reference, approximately 99 percent. The corresponding speed result was 78 percent. Two-site solutions reached five-percent accuracy for 83 percent of distances and 63 percent of speeds. The speed comparison used quadratic fits to complete tracks.

    A separate sample contained 365 three-site objects with at least 201 samples: 284 matched aircraft records, 17 had aircraft-like motion without a matching identity, and 64 were identified on inspection as small clouds. The authors reported no anomalous hypersonic motion or high acceleration among reliably tracked objects that week.

    A worked example: the same movement, ten times the speed

    Consider a hypothetical target moving across a stationary camera’s view at one degree per second. Assume its motion is perpendicular to the line of sight at that instant. One degree is approximately 0.01745 radians, so transverse speed is distance multiplied by 0.01745 per second.

    • At 500 metres, that is about 8.7 metres per second, or 31 kilometres per hour.
    • At 5,000 metres, it is about 87 metres per second, or 314 kilometres per hour.

    These are illustrative calculations, not Galileo detections. The image motion is identical; changing the range changes the inferred speed tenfold. Motion toward or away from the camera adds a component this simple calculation does not recover. A moving or panning camera also requires its own motion to be accounted for.

    Which evidence supports which claim?

    A single uncalibrated video can document an appearance and a sequence of events. With reliable timing and camera geometry, it can also measure angular motion. Neither automatically provides distance.

    Simultaneous observations from separated, calibrated cameras can constrain a three-dimensional position. Repeating that measurement allows a trajectory estimate. A comparison with known targets then tests whether the entire process works under those observing conditions. This is a stronger basis for a speed claim than estimating distance from how large or dramatic something looks.

    It is still important to ask how reference targets were selected and whether calibration and evaluation used independent data. Performance on readily matched aircraft does not automatically describe every faint or unfamiliar target. The paper identifies apparent size and thermal contrast as limits on what the array can detect.

    Where triangulation can mislead

    Calibration covers both the lens’s mapping of light onto pixels and the camera’s position and orientation, as explained in OpenCV’s camera-calibration reference. The geometric idea is simple: extend sightlines from known camera locations toward the same target. Their intersection constrains its position. In practice, imperfect measurements produce a region of possible positions. Nearly parallel sightlines constrain distance poorly, and a pointing error can shift the reconstructed track.

    Matching matters just as much. Pair one aircraft in the first camera with a different aircraft in the second, and the calculation can produce a position for an object that was never there. Timing offsets can similarly combine different moments of a moving target’s path.

    Speed uses changes in position; acceleration uses changes in velocity. Small positional fluctuations can therefore become large apparent accelerations. Smoothing can reduce that noise but can also blur brief real changes. A convincing acceleration claim should show its sensitivity to the processing choices.

    NASA’s independent UAP study report emphasizes calibrated sensors, multiple measurements and metadata such as acquisition time and observing conditions. Those details help another analyst test an explanation rather than simply watch the same clip.

    Unidentified is a separate question

    A missing flight-data match is not itself evidence of exceptional performance. The FAA describes specific ADS-B-required airspace, rather than a universal requirement covering every aircraft everywhere. Its equipment guidance also documents missing or incorrect broadcasts and transmitter or position-source failures. Those are possible limitations, not demonstrated explanations for any particular unidentified track.

    A repeatable reader’s checklist

    1. Find the range measurement. Was distance measured, bounded or simply assumed?
    2. Check the shared target. What supports matching the same object across cameras and timestamps?
    3. Read the uncertainty. Are errors stated separately for position, speed and acceleration?
    4. Inspect the processing. Do claimed extremes survive reasonable changes in smoothing and track selection?
    5. Separate identity from behaviour. Is the claim a missing label, an unusual measured trajectory, or both?
    6. Look for the comparison sample. Which known objects were tested, and which observations were excluded?

    The useful question is what additional measurement would distinguish the remaining explanations. A precise, reproducible uncertainty is more informative than a spectacular speed calculated from an assumed distance.

    Put the checks into practice

    Use our UAP video evidence checklist to build an evidence file, then compare witness reports with the methods in our NUFORC archive-reading guide. See the PR135 bird-wingbeat analysis for a complementary image-based test whose conclusions remain limited by missing flight data.

    Update note, 14 October 2026: Expanded the measurement explanation and separated the aircraft-validation sample from the filtered object-classification sample. Added the October arXiv record and an explicitly hypothetical speed calculation.

  • Could Lunar Dust Preserve Microscopic Traces of Ancient Technology?

    Research explainer | Published 8 October 2026; updated 14 October 2026

    A microscopic fragment in lunar soil could be scientifically interesting without being artificial. An artificial fragment could be human contamination. A credible search for extraterrestrial technology must resolve both questions, and keep them separate. That is the practical challenge behind a proposal to examine the Moon’s dust for ancient engineered particles.

    What the proposal actually establishes

    Lewis J. Pinault and colleagues model whether durable microscopic debris could survive interstellar travel, pass through the Solar System’s filtering effects and reach the Moon slowly enough to survive impact. Their original preprint uses approximately one cubic metre of regolith as a reference search volume. This is a calculation of what a search could test, not a report of recovered alien material.

    The paper first appeared on arXiv on 23 June 2026; version four was posted on 18 August. The SETI Institute’s 8 September announcement described it as under review at the International Journal of Astrobiology and explicitly reported no discovery. That announcement outlines automated screening followed by microscopy, spectroscopy and tomography. It also explains the Moon’s appeal: without Earth’s weather and surface recycling, ancient material has a better chance of persisting. Impacts nevertheless alter and mix its soil.

    The important distinction is between a promising archive and an easy search. Preserving material does not guarantee that its origin remains legible.

    First, learn what ordinary lunar dust can do

    Nature already makes complicated microscopic objects on the Moon. In a 2024 study of Apollo soil separates, researchers examined agglutinates: impact-produced mixtures of mineral fragments, glass and tiny iron particles. Their measurements showed that these aggregates help explain how mature lunar soils reflect light. Glass surrounding metal, therefore, is not automatically evidence of manufacture.

    For a future candidate, the useful question would be: which measurements distinguish it from the closest natural comparison? A striking image alone leaves that unanswered. Researchers could compare shape, internal structure and chemistry against relevant lunar materials, then ask whether one natural process accounts for the combination. Several unusual features are less persuasive if they all arise from the same ordinary impact process.

    Failure to identify a grain is also a weaker result than identifying a manufactured one. An honest report should preserve that distinction rather than promote an unexplained object into an extraterrestrial artifact.

    Second, audit the route from Moon to microscope

    Contamination is a testable alternative, not a reason to dismiss every sample. A 2018 study of Apollo curation equipment measured stainless-steel tools and containers. It found generally negligible effects on the bulk chemical properties investigated, while recommending case-by-case assessment. That reassurance does not by itself settle the origin of one unusual particle: bulk composition and a rare-grain search ask different questions.

    NASA curators’ account of lunar sample preservation describes nitrogen gloveboxes and tools with controlled compositions, while noting tensions between reducing particulate contamination and reducing organic contamination. Clean handling requires records as well as precautions.

    For this proposed search, a useful audit would record every container, tool, coating and preparation step a candidate encountered. A procedural blank, processed without lunar material, could reveal particles introduced by the workflow. Matching a candidate to a tool’s alloy would supply a concrete explanation. Conversely, failing to find a match would narrow the possibilities without proving an extraterrestrial origin.

    What would finding nothing tell us?

    The preprint’s negative-result argument is conditional: an adequately complete search could constrain particular models of long-lived artificial debris production and delivery. It cannot exclude civilizations that produced little suitable material, material that never arrived, or engineering signatures that did not survive recognizably. Its cubic-metre benchmark also requires attention to the fine material actually examined, not simply the volume collected.

    A practical comparison helps: a team that records every recovered grain and demonstrates its screening sensitivity has a more interpretable negative result than one that photographs a few visually interesting pieces from a large container. The container’s size cannot compensate for an unmeasured selection process. Testing recognition on concealed examples of known materials would help expose what the screening misses.

    A checklist for the next claim

    • Provenance: Is the collection location, depth and handling history documented?
    • Natural comparison: Which ordinary lunar material is the closest match, and what measurement rejects it?
    • Contamination: Were tools, containers and procedural blanks examined?
    • Reproducibility: Can another laboratory test the same claim using preserved material and shared methods?
    • Search completeness: How much material passed each screening stage, and which particle types could escape detection?

    These questions make the proposal worth following even before any candidate emerges. They turn an appealing possibility into standards a future result can meet or fail.

    Schedule correction retained from 13 October 2026 (UTC): the discussion date was corrected from 9 October. The SETI event listing gives 15 October 2026 at 2:30 p.m. PDT. This does not establish that an earlier discussion took place. On 14 October, this article was expanded with natural-material comparisons, contamination checks and limits on interpreting a negative search.

    Continue exploring the evidence

    Compare these standards with our guide to habitability and biosignature claims. Both searches need a measured signal, a natural comparison and a clear account of what remains uncertain.

  • Webb Reads the Mineral Debris of Collisions Around Other Stars

    Research news | 8 October 2026

    The wreckage around distant stars can preserve clues to how rocky worlds grow and break apart. Research highlighted by NASA on 1 October uses Webb and Spitzer observations to investigate unusually dusty systems known as extreme debris disks.

    The study analyzes infrared spectra from 21 systems. Its public manuscript was first posted on 7 July and is marked accepted for The Astrophysical Journal. ESA’s October release confirms that the findings have now been published in that journal. The research identifies an abundance of tiny grains whose minerals bear signs of heating, connecting altered dust and irregular infrared changes with large collisions during planetary evolution.

    Two mineral patterns

    NASA’s companion data graphic divides the sample into eight silica-rich disks and 13 silica-poor ones. The researchers associate the first group with more energetic impacts involving bodies on the scale of Mars, and the second with less intense collisions involving smaller, roughly Moon-sized objects.

    Those sizes describe the proposed collision scenarios. The observations measure the material left around the stars; they do not resolve individual impacts or provide photographs of planets smashing together. Mineral composition offers a way to test which histories could have produced the dust.

    The silica-rich systems in the sample occur around stars younger than 300 million years. Silica-poor systems cover a broader range of ages. That contrast could help distinguish early rocky-planet assembly from later periods when changing orbits stir up existing bodies.

    A window into Earth’s distant past

    The comparison is relevant to the leading explanation for the Moon’s origin, in which a large collision involving the young Earth produced orbiting debris. Studying other systems gives astronomers additional physical settings in which to examine the consequences of such events.

    There are important limits. ESA’s release notes that only three disks meet the study’s older-age criterion, leaving a small basis for testing whether older systems consistently lack silica-rich material. Expanding the sample is therefore a meaningful next step.

    This work concerns the construction and disruption of planetary systems. It supplies context for how rocky worlds emerge, without identifying a habitable planet or evidence of life in any of these disks.

  • Perseverance Traces Three Water Episodes in Jezero’s Ancient Rocks

    Research news | 8 October 2026

    Rocks beside an ancient Martian lake preserve a more complicated history than a shoreline alone would suggest. A study published on 21 September reconstructs three main episodes of water-driven alteration in Jezero crater’s Margin unit, using observations from NASA’s Perseverance rover.

    The work changes how researchers interpret a region selected partly because orbiters detected carbonate minerals there. Those minerals made the site interesting as a possible record of conditions in the old lake. Close-up measurements now connect the rocks to several distinct underground and surface processes.

    The sequence written into the minerals

    The paper describes higher exposures as crystalline, olivine-rich rock that cooled slowly and shows limited water alteration. Lower exposures record a different history. First, carbon-dioxide-rich fluids moved through bedrock and produced carbonate-rich features. Later, lake water or a change in groundwater altered the minerals further and deposited silica in available spaces.

    A final episode sent heated fluids through younger fractures, leaving calcium-sulfate veins containing fluorite. Crucially, the middle stage has more than one possible explanation: the researchers retain both lake exposure and changing groundwater conditions in their interpretation.

    Why the site matters for life searches

    As NASA explains, reactions between water and olivine on Earth can supply hydrogen used by some microbes. Carbonate and silica can also preserve traces of past organisms. That combination gives the Margin unit scientific value without establishing that any organisms were present.

    Perseverance’s SuperCam instrument analyzed more than 185 bedrock targets across the unit. The team can work out the order of the water events, but their ages remain undetermined. The rover first reached this region in 2023; the September announcement concerns the later scientific interpretation of its observations.

    For the search for ancient Martian life, the result supplies environmental context. A convincing biological interpretation would need evidence beyond minerals that water can produce without life. Here, the advance is a clearer account of where water moved, how it changed the rocks and which parts of that history deserve closer investigation.

  • Hubble’s Niobium Clue Points to a Planet Born After Its Star Aged

    Research news | 8 October 2026

    A planet may have formed from material expelled by an aging star, giving one distant system a second round of planet building. A study published on 5 October in Nature Astronomy identifies the white dwarf HS 0209+0832 as a promising case. The proposed world remains a candidate.

    A chemical pattern with an unusual explanation

    The researchers found that material reaching the white dwarf contains unusually large amounts of elements including zinc, copper and niobium, alongside relatively little silicon and iron. They interpret the enrichment in elements associated with the slow neutron-capture process as a clue that the material originated during the star’s giant phase.

    That is a different starting point from the gas and dust around a newborn star. In the team’s scenario, expelled stellar material gathered into a giant planet. Radiation from the hot remnant now removes some of its atmosphere, allowing that material to fall back toward the white dwarf.

    The paper also reports brightness changes repeating approximately every 4.4 days. The authors discuss a planetary day–night temperature cycle or an evaporating planet’s trailing material as possible explanations for this signal.

    Old observations, new tools

    According to NASA’s account of the research, Hubble observations from 1999 contained roughly 100 unidentified chemical features. An improved chemical database helped lead author Jamie Williams recognize niobium. Archived observations from the retired FUSE mission independently supported its presence.

    The proposed planet would be roughly Jupiter-sized and close to a still-hot stellar remnant. That makes this a study of unusual planet formation and atmospheric loss, with no reported evidence of life. Discussion of a future habitable zone as the star cools should not be read as a finding that this candidate is habitable now.

    The immediate importance is the possibility of a planetary system acquiring new members after its star has ended its ordinary lifetime. Establishing how often this happens will require more systems and more observations. For now, the chemistry offers a specific explanation that researchers can continue to test.

  • Chile’s Newly Published UAP Files Show Why Case Outcomes Need Context

    Chile’s official aerial-anomaly investigators published eleven case files on September 10, offering a detailed view of how reported lights and unusual shapes are assessed. The SEFAA release includes reports from 2021 alongside cases submitted between June and August 2026. The publication date should not be mistaken for the date of every sighting.

    Several files reach conventional explanations, while others retain qualified conclusions or document an investigation ending without enough original material.

    Different evidence, different conclusions

    For an August 13 observation in La Florida, investigators examined a phone video showing a light with changing colours. Case 2268 concludes that its behaviour and navigation-light characteristics were consistent with a drone-type aircraft capable of hovering and turning about its vertical axis.

    In a separate Reñaca report, witnesses described multiple lights. The material supplied for examination showed one luminous object. Case 2270 identifies that filmed object as Venus, while explaining how camera movement affected its apparent position.

    An August 21 photograph from Zapallar prompted a check beyond a public flight-tracking display. Investigators obtained radar information from air-traffic control and compared candidate aircraft with the image geometry. Case 2274 concludes that the photograph showed an aircraft contrail, possibly associated with a LATAM Airbus A320.

    Closed does not always mean identified

    A Calama report reached a different endpoint. The witness described several moving lights, but supplied no audiovisual files or precise observation location. After repeated requests for original material went unanswered, SEFAA closed Case 2271 under its evidence requirements.

    That distinction matters when interpreting a collection labelled as resolved cases. An explanation supported by image and positional analysis carries different information from an administrative closure caused by missing evidence.

    The files also demonstrate why a finding should remain attached to the material actually examined. Identifying one filmed light does not automatically reconstruct everything a witness reports seeing. Publishing the reasoning, confidence and limitations gives readers a more useful basis for judging a case than a headline count of solved or unsolved UFOs.

  • Hessdalen Adds Sensors and Compares a Witness Report With Camera Footage

    Project Hessdalen’s latest fieldwork report describes new monitoring equipment in the Norwegian valley and a rare opportunity to compare a witness’s account directly with a camera recording. The project announced the report on September 29, following its 2026 conference and field trip.

    At the Blue Box observing station, researchers installed an all-sky camera and upgraded software. They also retrieved magnetic-field loggers that had operated at different locations for almost three months. The field report says those instruments recorded no magnetic anomalies during that period.

    A Ukrainian team from Zond installed separate sensor boxes at two valley locations. They measure environmental conditions and magnetic fields, include accelerometers, and send readings over a mobile connection. The report describes near-real-time access and automatic notifications as work still being developed.

    One light, two descriptions

    The project’s case page records a sighting shortly after midnight local time on September 1. Its video timestamp is August 31 at 22:08:14 UTC. The witness described a light appearing at successive nearby positions, changing colour and seeming to grow, without visible movement between those positions.

    A camera near the community house recorded a distant light that the witness recognised as the event. Project Hessdalen says the timing and direction matched. Crucially, the case page states that the reported skipping between positions was not captured. It also says detailed video analysis is continuing.

    The field report describes the filmed movement as resembling a small meteor. That remains a comparison in the project’s account, rather than a completed identification.

    A useful, limited comparison

    These records allow readers to separate the reported experience from what the camera preserved. Recognising the same event does not establish that every perceived feature is visible in the recording.

    The magnetic result is similarly bounded by where the instruments operated and when they sampled. It cannot settle every account from the valley. The practical advance is a more documented observation process, with an explicit distinction between installed equipment, planned capabilities and analysis still in progress.