The official record of Japan Air Lines Flight 1628 contains a technical explanation that is often overshadowed by the crew’s visual account. After the November 17, 1986 Alaska sighting, the Federal Aviation Administration examined whether an additional radar indication represented another aircraft. Its surviving paperwork explains why the agency concluded that the display could show two returns from the same Boeing 747.
What the FAA set out to establish
The agency’s March 5, 1987 news release, preserved in this scan of FAA documents, states that its purpose was to investigate a possible unreported aircraft and resulting safety hazard. It released pilot-controller communications, interviews, radar plots and other material, while saying it could not confirm the reported UFO event.
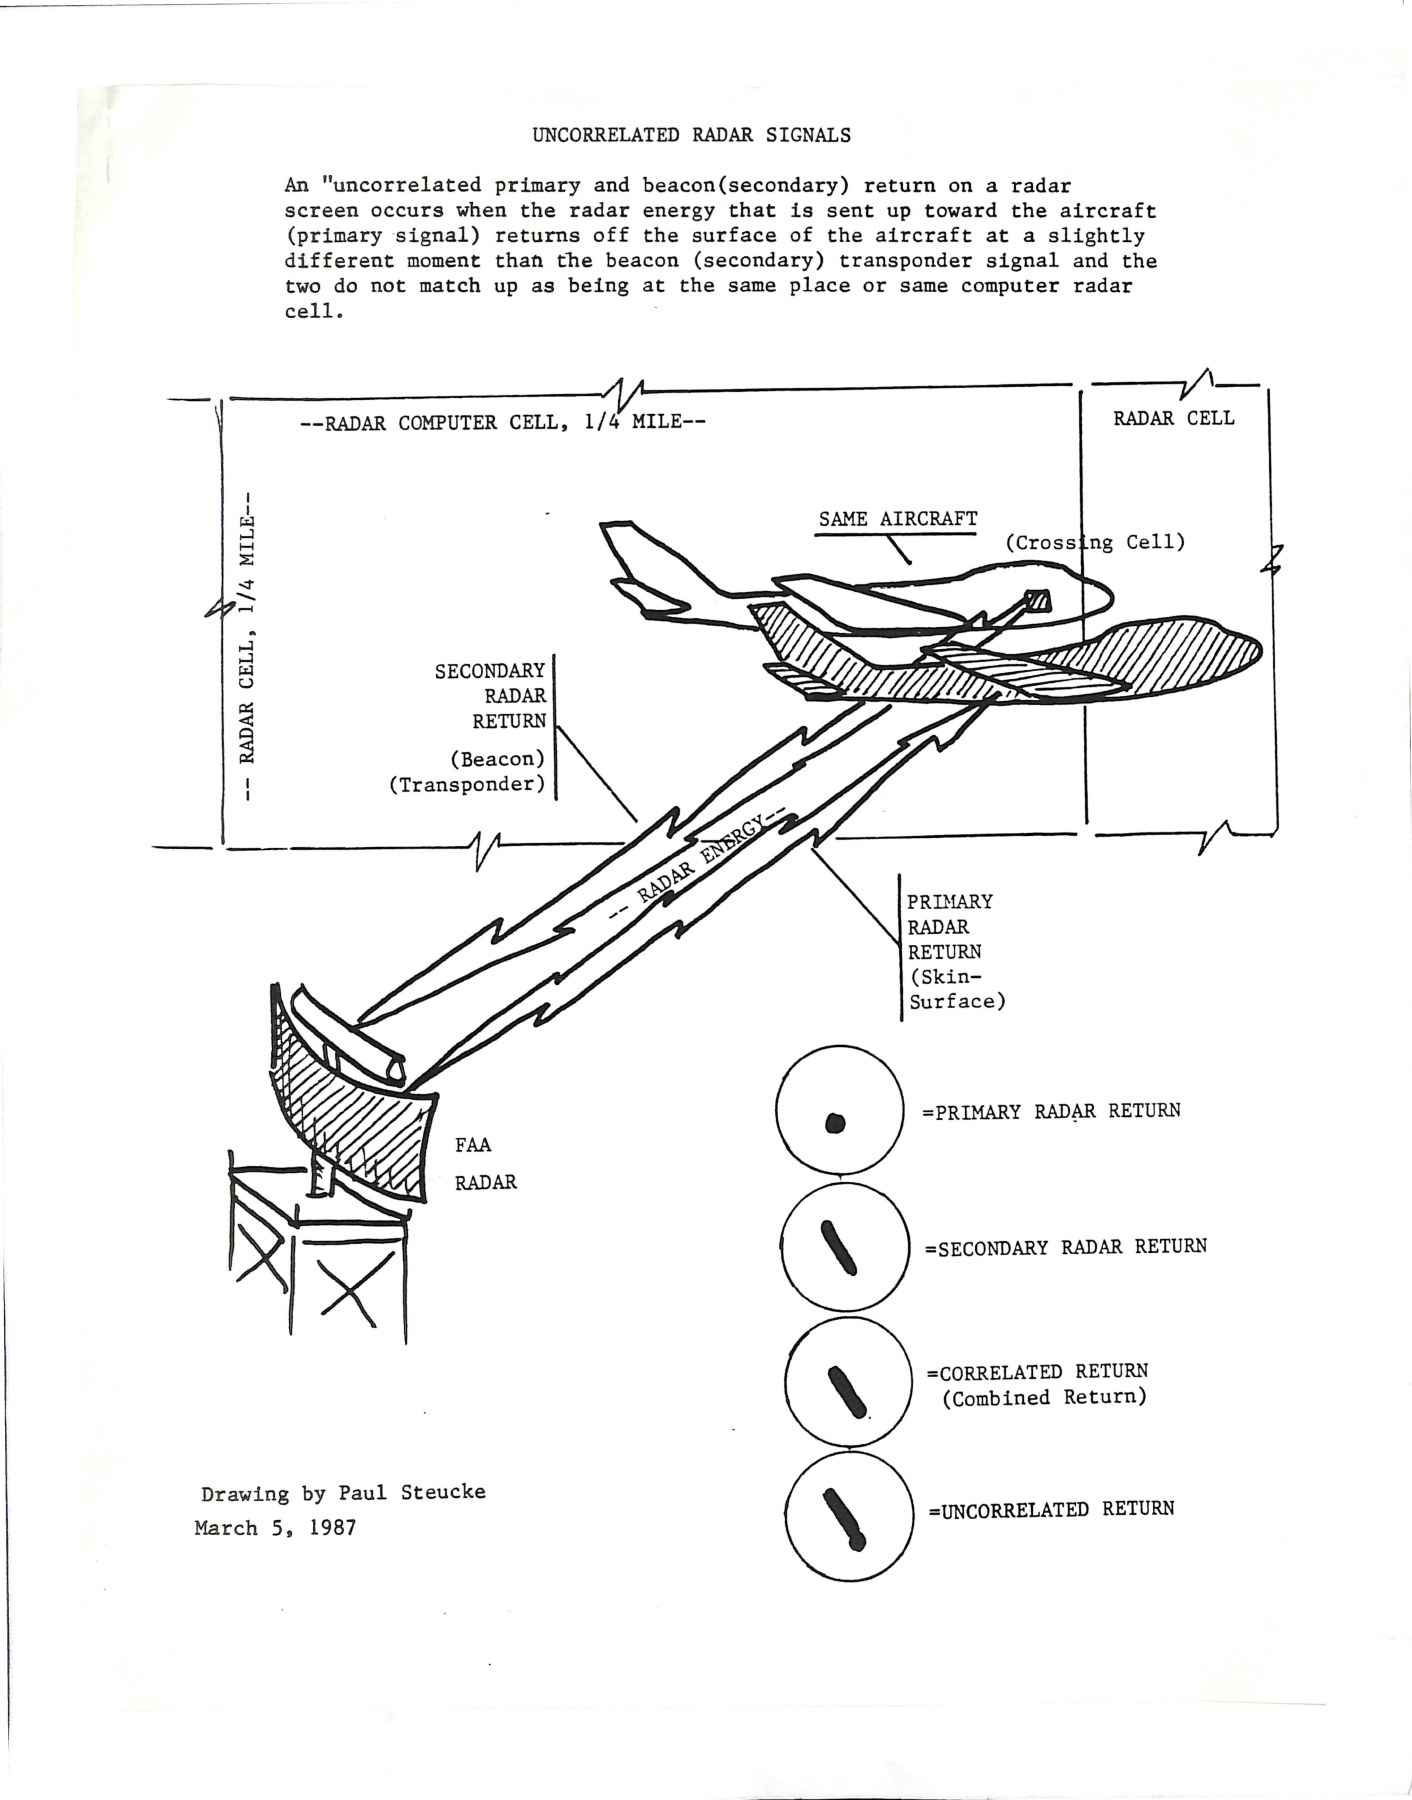
The release attributes the nearby second target to an uncorrelated primary and beacon return. It also says a United Air Lines aircraft directed toward the JAL flight saw the freighter but nothing else. The FAA concluded that air-traffic-control safety had not been compromised and announced no further investigation. Those are the agency’s stated findings, not independent observations made by the later archive hosting the scans.
Two signals from one aircraft
The accompanying technical packet makes the explanation more concrete. Primary radar receives energy reflected from an aircraft’s surface. A beacon return comes from its transponder. The system has to associate those signals with the same position; a mismatch can leave separate indications.
Dennis R. Simantel’s analysis, dated February 25, 1987, describes approximately 61 minutes of extracted data. It says 72 percent of replies had primary and beacon returns in the same quarter-mile range cell. Approximately 25 percent registered as beacon-only; within that subset, 90 percent had a primary-only return within one-eighth of a mile ahead or behind.
The analysis connects these separations to timing and correlation circuitry, and says comparable data from another aircraft in the area were considered normal. A February 27 memorandum forwards the analysis. A March 5 explanatory drawing then shows how one aircraft crossing between cells could produce separated display symbols.
What the explanation can settle
A radar interpretation must be evaluated against the radar claim it addresses. Showing a mechanism for two display indications weakens the inference that two physical aircraft were necessarily present. It does not, by itself, identify every light reported through a cockpit window. Those are different observations requiring their own comparisons.
The distinction also protects the controllers’ work from unfair hindsight. An operator responding to possible traffic must act on available information. A later analyst can review a longer sequence and compare patterns that were harder to evaluate during the encounter. Operational caution and subsequent technical reassessment can both be reasonable.
The National Archives lists the JAL records under FAA Record Group 237, giving researchers a route beyond quotations repeated in popular accounts. For this part of the case, the most useful starting point is the dated analysis and its diagram: they identify the mechanism the FAA proposed, the data it summarized and the limited question its conclusion addressed.
Leave a Reply