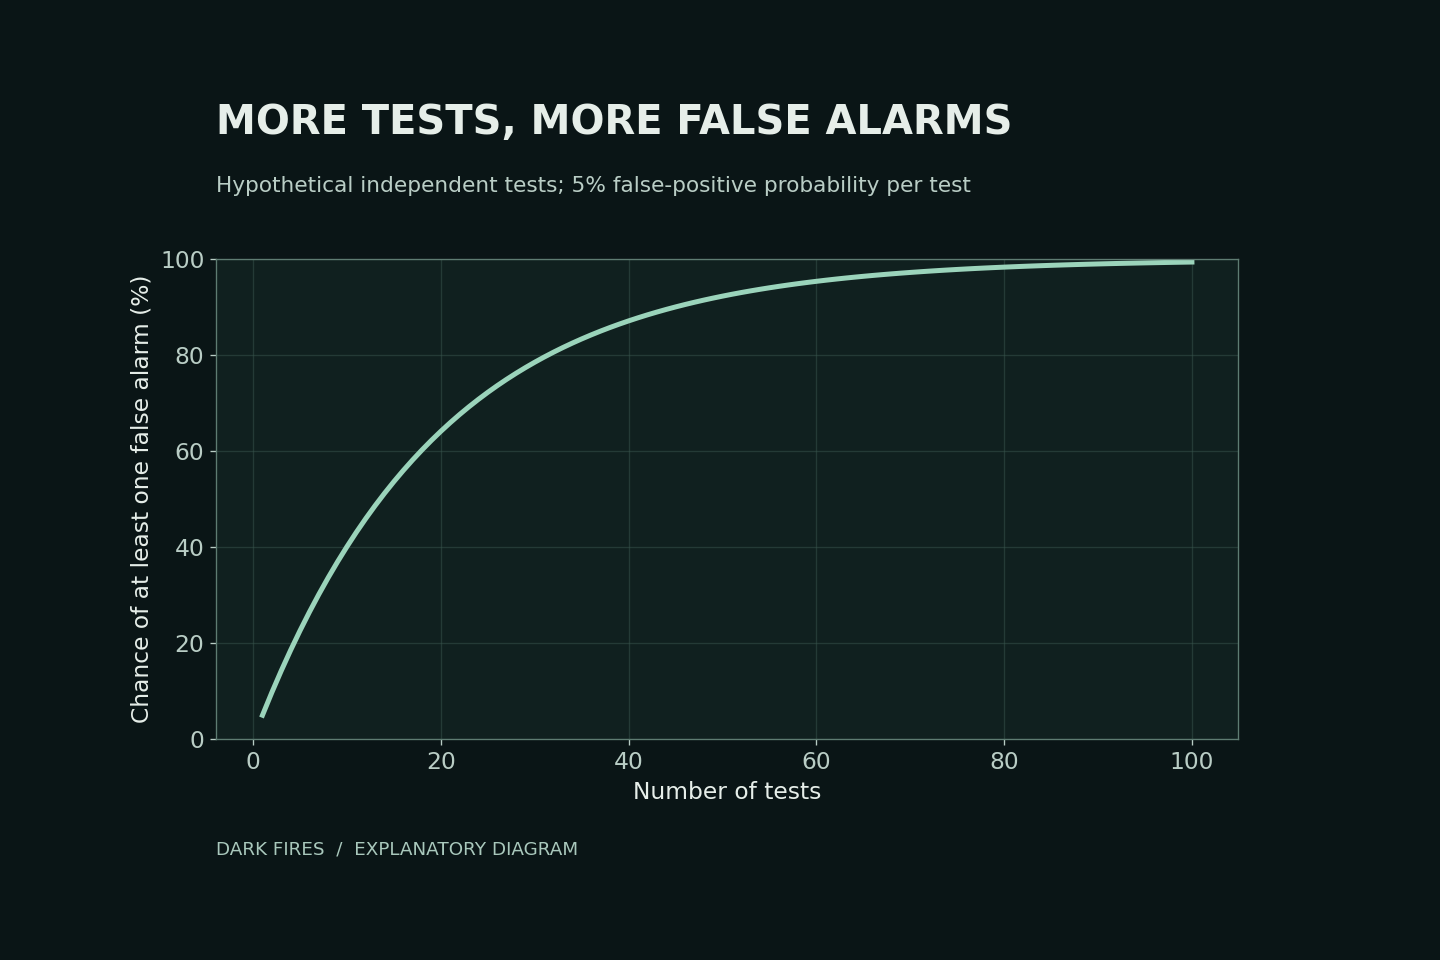
A search through many frequencies, time windows or image regions has more opportunities to find a striking coincidence than one preselected test. Reporting only the strongest result hides that difference.
Twenty chances are not one chance
Suppose each of twenty independent tests has a 5% false-positive probability when its null model is correct. The chance of at least one false positive is 1 − 0.95²⁰, approximately 64%. It is not 5%, and it is not a guarantee that any particular flagged result is false.
This calculation assumes independence and correctly calibrated tests. Real UAP searches may contain correlated frames or overlapping windows, so substituting their raw number into this formula can be misleading.
Plan the comparison family
NIST describes the Bonferroni approach: for a defined family of g comparisons, use an individual significance level of α/g to bound the family’s error probability by α. That bound does not require independence, although the method can be conservative.
For a hypothetical family of twenty tests and a 5% overall target, the individual threshold becomes 0.0025. The arithmetic is easy; deciding honestly which searches belong to the family is harder.
Record the tested regions, thresholds and stopping rule before selecting a standout. Preserve unsuccessful tests and use genuinely new data for confirmation. A corrected statistical anomaly still requires a physical explanation; it does not identify an extraterrestrial cause.
Primary source: NIST on Bonferroni multiple comparisons.
Generated illustration. Original Dark Fires calculation for independent hypothetical tests, not measured UAP statistics.
Leave a Reply