A statistical result can challenge a model without identifying what produced the observation. That distinction matters when an unusual UAP measurement is described as “too unlikely to be chance.”
Which probability is being calculated?
A p-value describes how incompatible the data are with a specified statistical model, through the probability of a result at least as extreme as the observed test statistic under that model. It is not the probability that the model is true, or that the observation has an extraterrestrial cause.
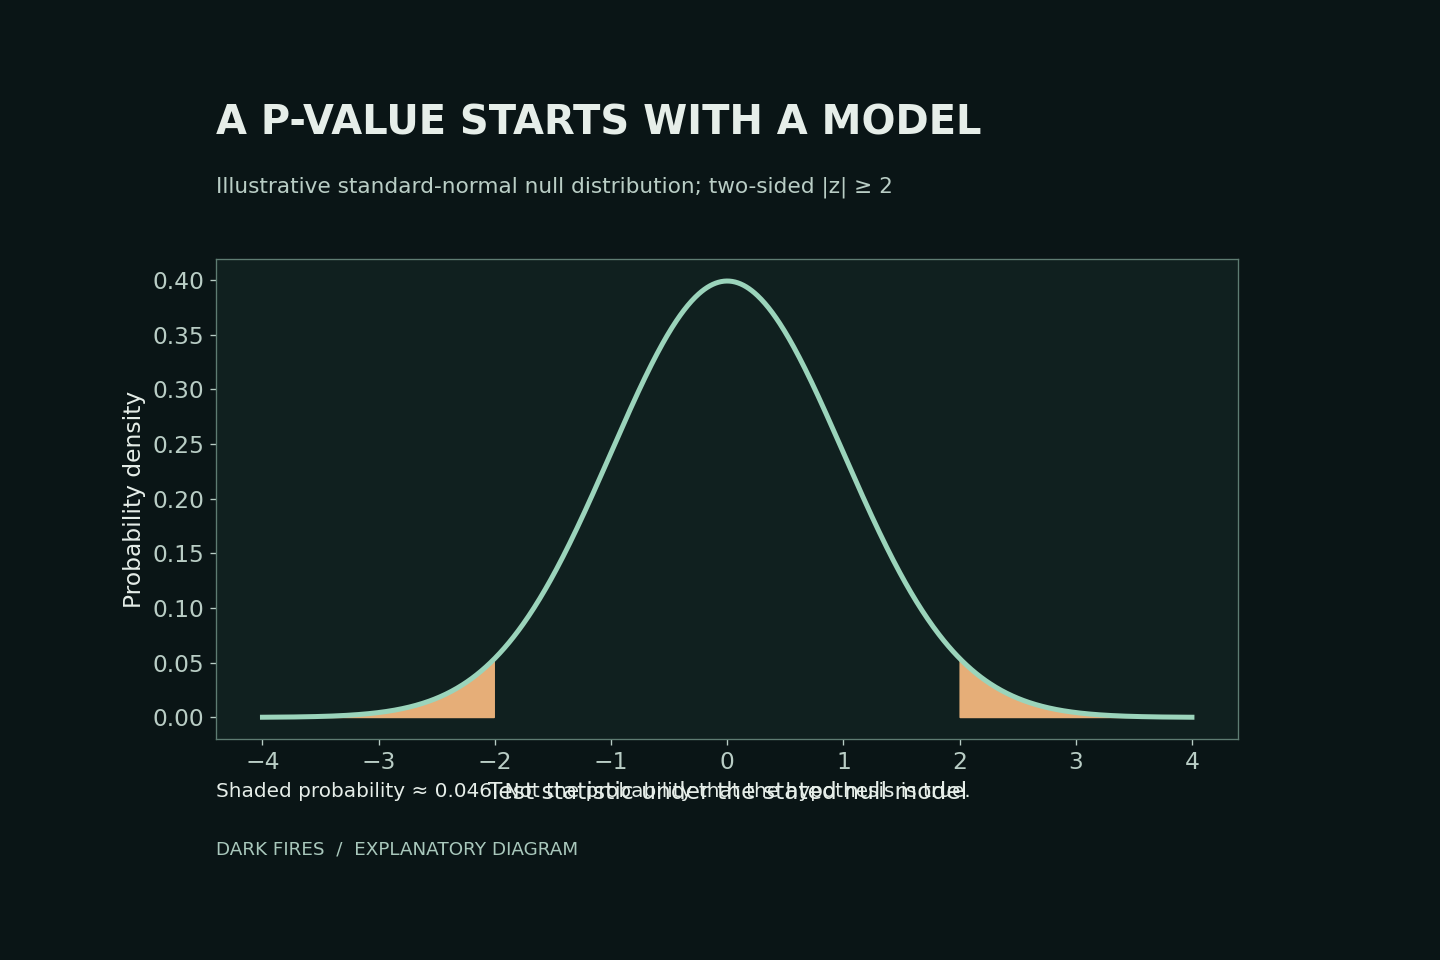
Our diagram uses a standard normal model. A two-sided test with a statistic of 2 has a p-value of approximately 0.046: the shaded tails beyond −2 and +2. This does not mean there is a 4.6% probability that the null hypothesis is correct.
Ask what was left outside the model
The American Statistical Association’s 2016 statement warns against treating a threshold as a substitute for scientific reasoning. Statistical significance also does not measure the size or importance of an effect.
In a UAP analysis, inspect calibration errors, the selected sample, model assumptions and the actual magnitude of the discrepancy. Rejecting one ordinary explanation does not test every other ordinary explanation. Compare explicit alternatives and seek independent measurements before turning model disagreement into a claim about origin.
Primary source: American Statistical Association statement, March 7, 2016.
Generated illustration. Original Dark Fires plot of a hypothetical normal-model test, not a UAP measurement.
Leave a Reply