A sky survey can operate for months without producing a convincing anomalous detection and still make a scientific contribution. The essential question is what population of events it was capable of finding. A survey that measures its limits can constrain a claim; one that merely accumulates recording hours cannot turn silence into a reliable rate.
Define the target before counting
“No UAP detected” is too broad unless the survey explains what counted as a detection. Was it looking for objects above a minimum infrared brightness, within a measured distance, or exhibiting a specified motion? Were ambiguous tracks retained for follow-up or discarded? These choices define the result’s reach.
Consider a deliberately simplified example: a survey looks for a defined class of bright events within a fixed monitored region. It obtains 100 usable hours and detects none. If events occur independently at a steady rate, and every qualifying event would be detected, the Poisson distribution described by NIST gives a useful way to interpret that zero.
When the expected count is about three, the probability of observing zero is about five percent. Under those assumptions, zero detections therefore gives an approximately 95-percent one-sided upper confidence limit of three expected events over the observation period. In this illustrative 100-hour survey, that corresponds to roughly 0.03 events per hour in the defined monitored region.
This is a statistical limit under a model, not a 95-percent probability that every conceivable anomalous object is absent. It says nothing about objects outside the survey’s region or below its sensitivity threshold. The example is a calculation, not a reported result from an actual UAP observatory.
Count the chances the instrument really had
If the system catches only half of qualifying events, the same observing time provides less constraining power. Weather, blocked sightlines, maintenance and selection rules can all reduce effective exposure. Efficiency may also change with distance, speed, apparent size and brightness, so one percentage may not describe the entire search.
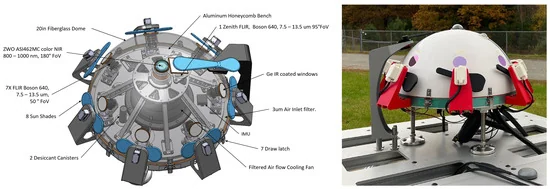
A practical example of measuring those losses appears in the Galileo Project’s January 28, 2025 infrared-array commissioning paper. The authors reported 41-percent acceptance for ADS-B-equipped aircraft passing through the effective field of view within range, and a separate mean frame-by-frame aircraft detection efficiency of 36 percent. Those quantities describe different stages of the system and should not be casually interchanged.
Nor can aircraft performance automatically establish sensitivity to every unknown object. A small, faint or unusually fast target might interact differently with the detection and tracking software. Simulated signals and known comparison targets can help measure those differences, provided the tests reproduce the conditions relevant to the proposed search.
Publish the limits with the result
A useful null-result report should state the observing interval, usable coverage, target definition, detection efficiency and statistical assumptions. It should also explain how unresolved candidates were handled. Zero confirmed anomalies is not necessarily the same dataset as zero candidates.
This approach gives future observers something concrete to improve: longer effective exposure, broader coverage or a better-tested detection threshold. It also lets a claimed event rate face a meaningful test. Finding nothing becomes informative when the survey shows, quantitatively, what it was positioned to find.
Featured image: Technical drawing and photograph of the Galileo Project’s Dalek infrared array. Credit: Laura Domine and colleagues, Sensors (2025), Figure 1, CC BY 4.0. Image source. License: CC BY 4.0.
Leave a Reply