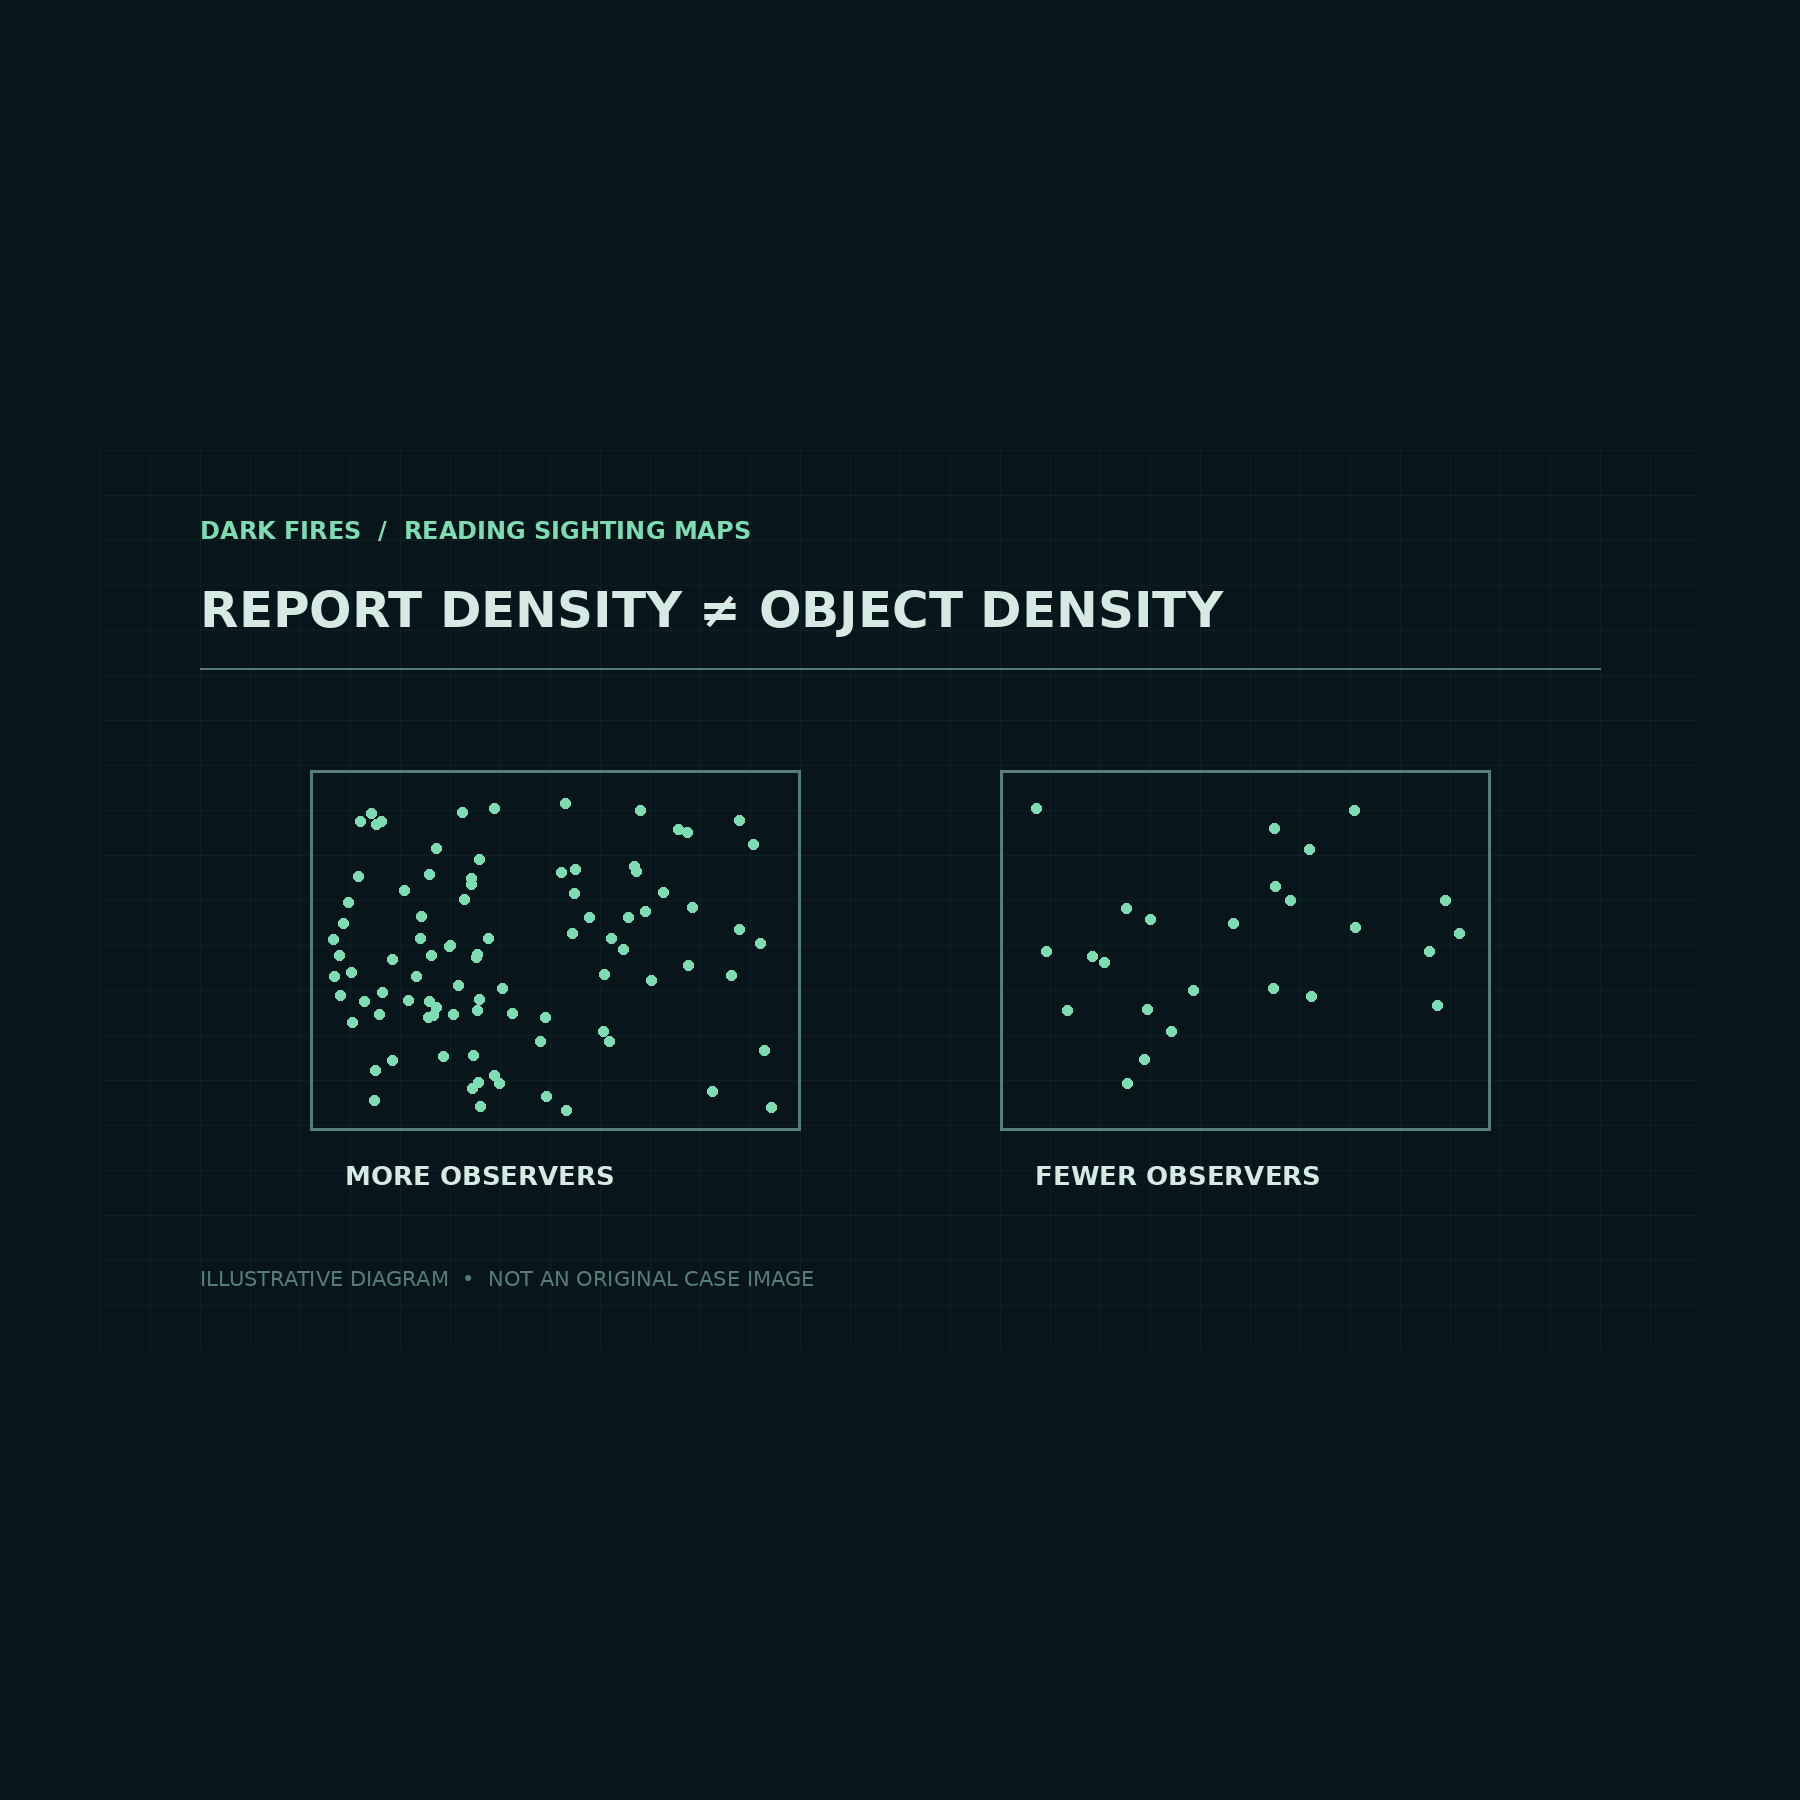
A map covered in UFO reports can make some places look unusually active. But the dots mark reports made by people under particular conditions. Before treating a concentration as evidence about unfamiliar objects, an analyst needs to ask who could see the sky, what was visible there, and how reports entered the database.
A geographical test of opportunity
A study published in Scientific Reports on December 14, 2023 examined more than 98,000 public UAP reports from the contiguous United States over 2001–2020. Richard Medina, Simon Brewer and Sean Kirkpatrick compared county-level reporting with variables describing sky visibility and airborne activity.
Their model found a clear positive association with air traffic and a negative one with light pollution. Other results were less decisive: cloud cover did not show a credible relationship, while tree canopy and military-area measures carried greater uncertainty. The study supports investigating observing conditions; it does not justify saying that every environmental variable explained the pattern equally well.
Most importantly, an association across counties cannot identify the object in one report. A relationship with air traffic makes aircraft-related explanations worth examining. It does not establish that a particular witness saw an aircraft, still less which flight it was.
The denominator changes the question
Consider a hypothetical comparison, not a result from that study. Town A produces 100 reports in a year and Town B produces 20. If A has ten times as many residents, B has twice as many reports per resident. Neither calculation tells us the rate per hour actually spent observing the sky.
Suppose residents of B spend much more time outdoors after dark, or a local reporting campaign makes them more likely to submit an account. The per-resident rate would then combine differences in opportunity with differences in submission behavior. Dividing by population solves one comparison problem while leaving others open.
The same issue applies to a changing total over time. A new reporting website could collect more accounts without any increase in the underlying number of unusual observations. Conversely, a genuine increase in airborne activity could coexist with declining reports if fewer people knew where to send them. These are alternative possibilities an analysis should test, rather than facts to assume about a particular archive.
What would strengthen a hotspot claim?
A useful map should identify the reporting period, geographical unit, duplicate-handling rules and denominator. It should explain whether locations refer to observers or estimated object positions. Reports of one widely visible event should not automatically be treated as many independent objects.
For an observing network, a stronger comparison would track exposure directly: usable camera-hours, monitored sky area, weather interruptions and detection thresholds. Two sites could then be compared on a more consistent basis. Human reports remain valuable for finding events and reconstructing experiences, but their collection process belongs in the analysis.
The practical lesson is to treat a hotspot as a question generator. It can suggest where to examine air traffic, visibility, reporting practices or individual cases more closely. Establishing an unusual population of objects requires additional measurements beyond a dense patch of dots.
Featured image: Generated illustration. Original Dark Fires explanatory diagram; dots are illustrative, not an observed dataset.
Leave a Reply